Immigrants from Yemen vs Laotian In Labor Force | Age 45-54
COMPARE
Immigrants from Yemen
Laotian
In Labor Force | Age 45-54
In Labor Force | Age 45-54 Comparison
Immigrants from Yemen
Laotians
74.4%
IN LABOR FORCE | AGE 45-54
0.0/ 100
METRIC RATING
344th/ 347
METRIC RANK
82.9%
IN LABOR FORCE | AGE 45-54
62.8/ 100
METRIC RATING
160th/ 347
METRIC RANK
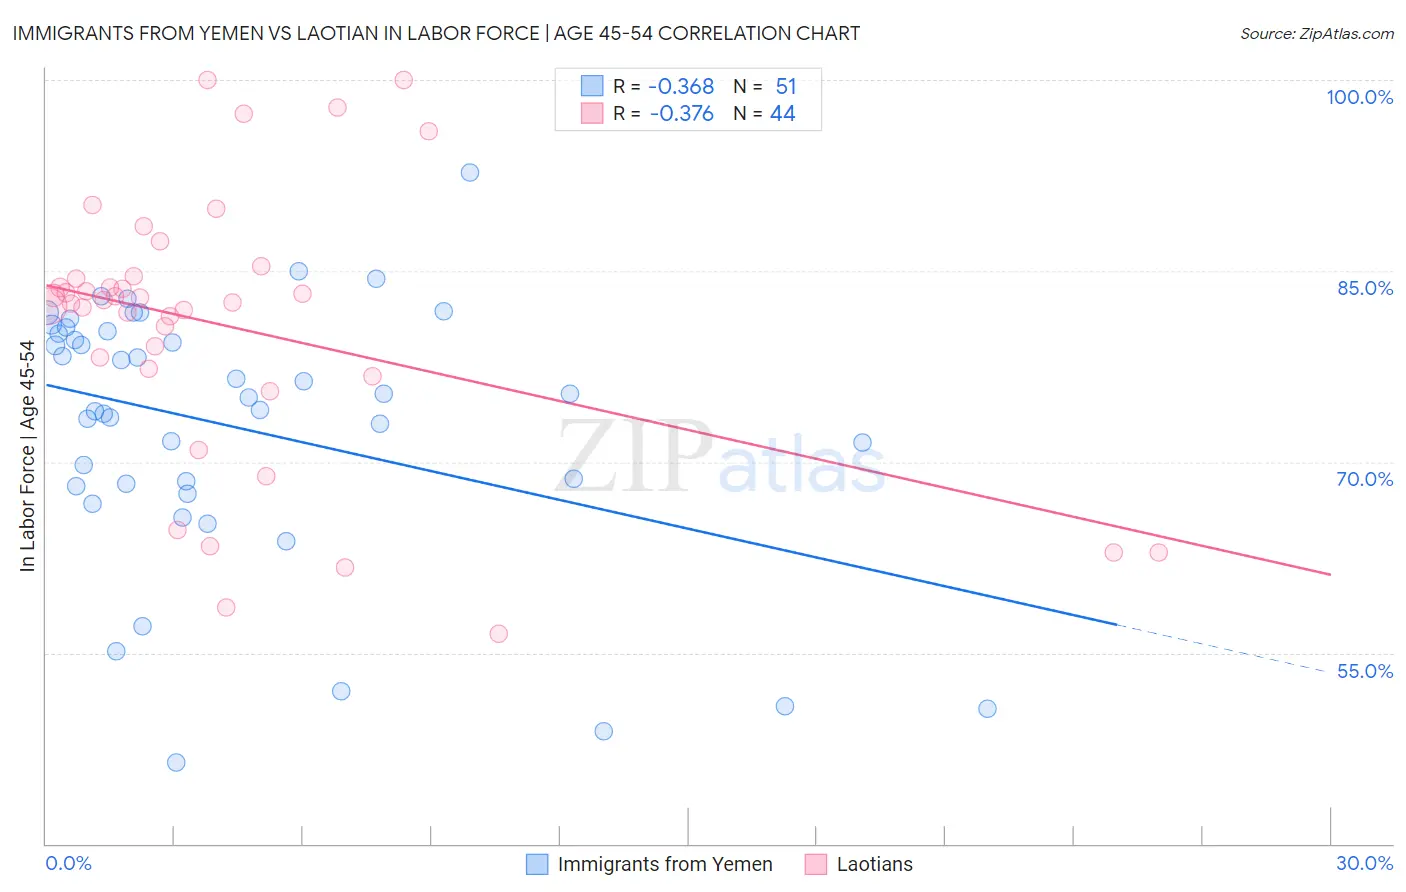
Immigrants from Yemen vs Laotian In Labor Force | Age 45-54 Correlation Chart
The statistical analysis conducted on geographies consisting of 82,433,611 people shows a mild negative correlation between the proportion of Immigrants from Yemen and labor force participation rate among population between the ages 45 and 54 in the United States with a correlation coefficient (R) of -0.368 and weighted average of 74.4%. Similarly, the statistical analysis conducted on geographies consisting of 224,742,074 people shows a mild negative correlation between the proportion of Laotians and labor force participation rate among population between the ages 45 and 54 in the United States with a correlation coefficient (R) of -0.376 and weighted average of 82.9%, a difference of 11.3%.
In Labor Force | Age 45-54 Correlation Summary
| Measurement | Immigrants from Yemen | Laotian |
| Minimum | 46.4% | 56.5% |
| Maximum | 92.7% | 100.0% |
| Range | 46.3% | 43.5% |
| Mean | 72.7% | 80.6% |
| Median | 75.1% | 82.6% |
| Interquartile 25% (IQ1) | 68.1% | 77.0% |
| Interquartile 75% (IQ3) | 80.3% | 84.5% |
| Interquartile Range (IQR) | 12.2% | 7.5% |
| Standard Deviation (Sample) | 10.4% | 10.7% |
| Standard Deviation (Population) | 10.3% | 10.5% |
Similar Demographics by In Labor Force | Age 45-54
Demographics Similar to Immigrants from Yemen by In Labor Force | Age 45-54
In terms of in labor force | age 45-54, the demographic groups most similar to Immigrants from Yemen are Houma (74.1%, a difference of 0.48%), Hopi (75.0%, a difference of 0.78%), Tohono O'odham (75.1%, a difference of 0.96%), Pueblo (75.5%, a difference of 1.5%), and Lumbee (75.6%, a difference of 1.6%).
| Demographics | Rating | Rank | In Labor Force | Age 45-54 |
| Natives/Alaskans | 0.0 /100 | #333 | Tragic 77.1% |
| Apache | 0.0 /100 | #334 | Tragic 77.1% |
| Arapaho | 0.0 /100 | #335 | Tragic 77.1% |
| Paiute | 0.0 /100 | #336 | Tragic 76.7% |
| Ute | 0.0 /100 | #337 | Tragic 76.6% |
| Yuman | 0.0 /100 | #338 | Tragic 76.3% |
| Puerto Ricans | 0.0 /100 | #339 | Tragic 75.9% |
| Lumbee | 0.0 /100 | #340 | Tragic 75.6% |
| Pueblo | 0.0 /100 | #341 | Tragic 75.5% |
| Tohono O'odham | 0.0 /100 | #342 | Tragic 75.1% |
| Hopi | 0.0 /100 | #343 | Tragic 75.0% |
| Immigrants | Yemen | 0.0 /100 | #344 | Tragic 74.4% |
| Houma | 0.0 /100 | #345 | Tragic 74.1% |
| Pima | 0.0 /100 | #346 | Tragic 72.8% |
| Navajo | 0.0 /100 | #347 | Tragic 72.8% |
Demographics Similar to Laotians by In Labor Force | Age 45-54
In terms of in labor force | age 45-54, the demographic groups most similar to Laotians are South American Indian (82.9%, a difference of 0.010%), Haitian (82.8%, a difference of 0.010%), Dutch (82.8%, a difference of 0.010%), German Russian (82.8%, a difference of 0.010%), and Immigrants from Austria (82.9%, a difference of 0.020%).
| Demographics | Rating | Rank | In Labor Force | Age 45-54 |
| Immigrants | Indonesia | 70.6 /100 | #153 | Good 82.9% |
| Immigrants | Ghana | 70.3 /100 | #154 | Good 82.9% |
| Immigrants | Philippines | 69.0 /100 | #155 | Good 82.9% |
| Immigrants | Saudi Arabia | 68.8 /100 | #156 | Good 82.9% |
| Immigrants | Australia | 68.2 /100 | #157 | Good 82.9% |
| Immigrants | Southern Europe | 67.8 /100 | #158 | Good 82.9% |
| Immigrants | Austria | 64.6 /100 | #159 | Good 82.9% |
| Laotians | 62.8 /100 | #160 | Good 82.9% |
| South American Indians | 62.2 /100 | #161 | Good 82.9% |
| Haitians | 61.8 /100 | #162 | Good 82.8% |
| Dutch | 61.7 /100 | #163 | Good 82.8% |
| German Russians | 61.3 /100 | #164 | Good 82.8% |
| Immigrants | Sudan | 59.9 /100 | #165 | Average 82.8% |
| Immigrants | South Eastern Asia | 57.4 /100 | #166 | Average 82.8% |
| Swiss | 56.5 /100 | #167 | Average 82.8% |