Immigrants from Taiwan vs Laotian Median Household Income
COMPARE
Immigrants from Taiwan
Laotian
Median Household Income
Median Household Income Comparison
Immigrants from Taiwan
Laotians
$116,460
MEDIAN HOUSEHOLD INCOME
100.0/ 100
METRIC RATING
1st/ 347
METRIC RANK
$94,990
MEDIAN HOUSEHOLD INCOME
99.8/ 100
METRIC RATING
61st/ 347
METRIC RANK
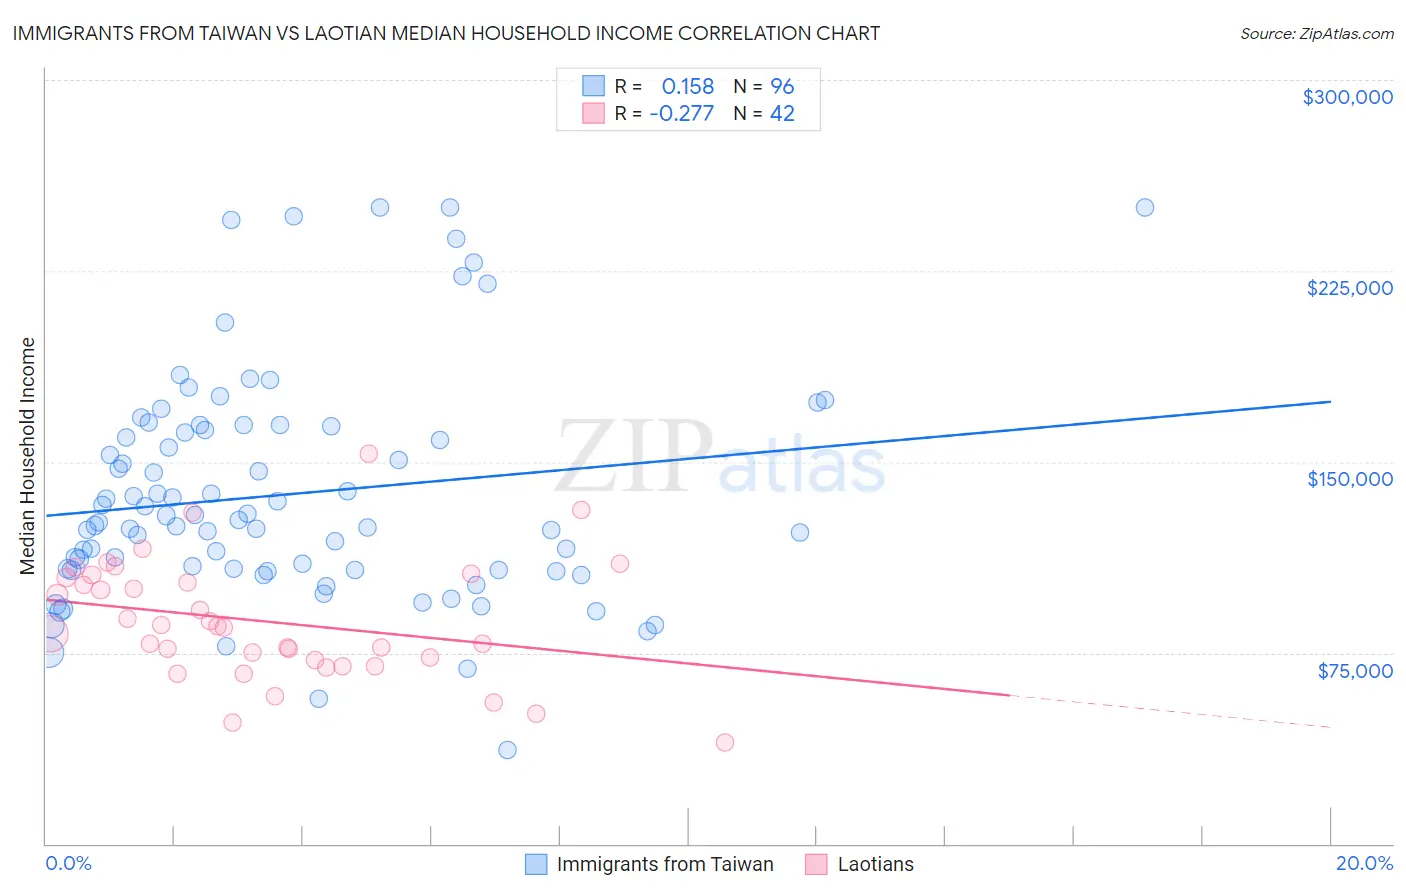
Immigrants from Taiwan vs Laotian Median Household Income Correlation Chart
The statistical analysis conducted on geographies consisting of 298,086,025 people shows a poor positive correlation between the proportion of Immigrants from Taiwan and median household income in the United States with a correlation coefficient (R) of 0.158 and weighted average of $116,460. Similarly, the statistical analysis conducted on geographies consisting of 224,713,642 people shows a weak negative correlation between the proportion of Laotians and median household income in the United States with a correlation coefficient (R) of -0.277 and weighted average of $94,990, a difference of 22.6%.
Median Household Income Correlation Summary
| Measurement | Immigrants from Taiwan | Laotian |
| Minimum | $37,017 | $39,542 |
| Maximum | $250,001 | $153,021 |
| Range | $212,984 | $113,479 |
| Mean | $137,283 | $87,400 |
| Median | $126,701 | $85,171 |
| Interquartile 25% (IQ1) | $107,640 | $72,352 |
| Interquartile 75% (IQ3) | $163,259 | $104,389 |
| Interquartile Range (IQR) | $55,619 | $32,037 |
| Standard Deviation (Sample) | $44,785 | $23,584 |
| Standard Deviation (Population) | $44,551 | $23,302 |
Similar Demographics by Median Household Income
Demographics Similar to Immigrants from Taiwan by Median Household Income
In terms of median household income, the demographic groups most similar to Immigrants from Taiwan are Filipino ($115,509, a difference of 0.82%), Immigrants from India ($113,009, a difference of 3.0%), Immigrants from Hong Kong ($111,519, a difference of 4.4%), Thai ($110,648, a difference of 5.2%), and Immigrants from Singapore ($110,428, a difference of 5.5%).
| Demographics | Rating | Rank | Median Household Income |
| Immigrants | Taiwan | 100.0 /100 | #1 | Exceptional $116,460 |
| Filipinos | 100.0 /100 | #2 | Exceptional $115,509 |
| Immigrants | India | 100.0 /100 | #3 | Exceptional $113,009 |
| Immigrants | Hong Kong | 100.0 /100 | #4 | Exceptional $111,519 |
| Thais | 100.0 /100 | #5 | Exceptional $110,648 |
| Immigrants | Singapore | 100.0 /100 | #6 | Exceptional $110,428 |
| Iranians | 100.0 /100 | #7 | Exceptional $109,835 |
| Immigrants | Iran | 100.0 /100 | #8 | Exceptional $108,055 |
| Okinawans | 100.0 /100 | #9 | Exceptional $106,624 |
| Immigrants | South Central Asia | 100.0 /100 | #10 | Exceptional $106,057 |
| Immigrants | China | 100.0 /100 | #11 | Exceptional $105,335 |
| Indians (Asian) | 100.0 /100 | #12 | Exceptional $105,262 |
| Immigrants | Eastern Asia | 100.0 /100 | #13 | Exceptional $104,796 |
| Immigrants | Ireland | 100.0 /100 | #14 | Exceptional $104,692 |
| Immigrants | Israel | 100.0 /100 | #15 | Exceptional $104,090 |
Demographics Similar to Laotians by Median Household Income
In terms of median household income, the demographic groups most similar to Laotians are Korean ($95,018, a difference of 0.030%), Immigrants from Europe ($95,032, a difference of 0.040%), Soviet Union ($95,098, a difference of 0.11%), Immigrants from Norway ($94,846, a difference of 0.15%), and New Zealander ($95,146, a difference of 0.16%).
| Demographics | Rating | Rank | Median Household Income |
| Egyptians | 99.9 /100 | #54 | Exceptional $95,673 |
| Immigrants | Czechoslovakia | 99.9 /100 | #55 | Exceptional $95,319 |
| Immigrants | Austria | 99.9 /100 | #56 | Exceptional $95,277 |
| New Zealanders | 99.8 /100 | #57 | Exceptional $95,146 |
| Soviet Union | 99.8 /100 | #58 | Exceptional $95,098 |
| Immigrants | Europe | 99.8 /100 | #59 | Exceptional $95,032 |
| Koreans | 99.8 /100 | #60 | Exceptional $95,018 |
| Laotians | 99.8 /100 | #61 | Exceptional $94,990 |
| Immigrants | Norway | 99.8 /100 | #62 | Exceptional $94,846 |
| Greeks | 99.8 /100 | #63 | Exceptional $94,735 |
| Immigrants | Netherlands | 99.7 /100 | #64 | Exceptional $94,411 |
| Immigrants | Belarus | 99.7 /100 | #65 | Exceptional $94,399 |
| Immigrants | Romania | 99.7 /100 | #66 | Exceptional $94,222 |
| Immigrants | Scotland | 99.7 /100 | #67 | Exceptional $94,091 |
| Mongolians | 99.7 /100 | #68 | Exceptional $93,971 |