Immigrants from South America vs Laotian In Labor Force | Age 45-54
COMPARE
Immigrants from South America
Laotian
In Labor Force | Age 45-54
In Labor Force | Age 45-54 Comparison
Immigrants from South America
Laotians
83.2%
IN LABOR FORCE | AGE 45-54
93.5/ 100
METRIC RATING
105th/ 347
METRIC RANK
82.9%
IN LABOR FORCE | AGE 45-54
62.8/ 100
METRIC RATING
160th/ 347
METRIC RANK
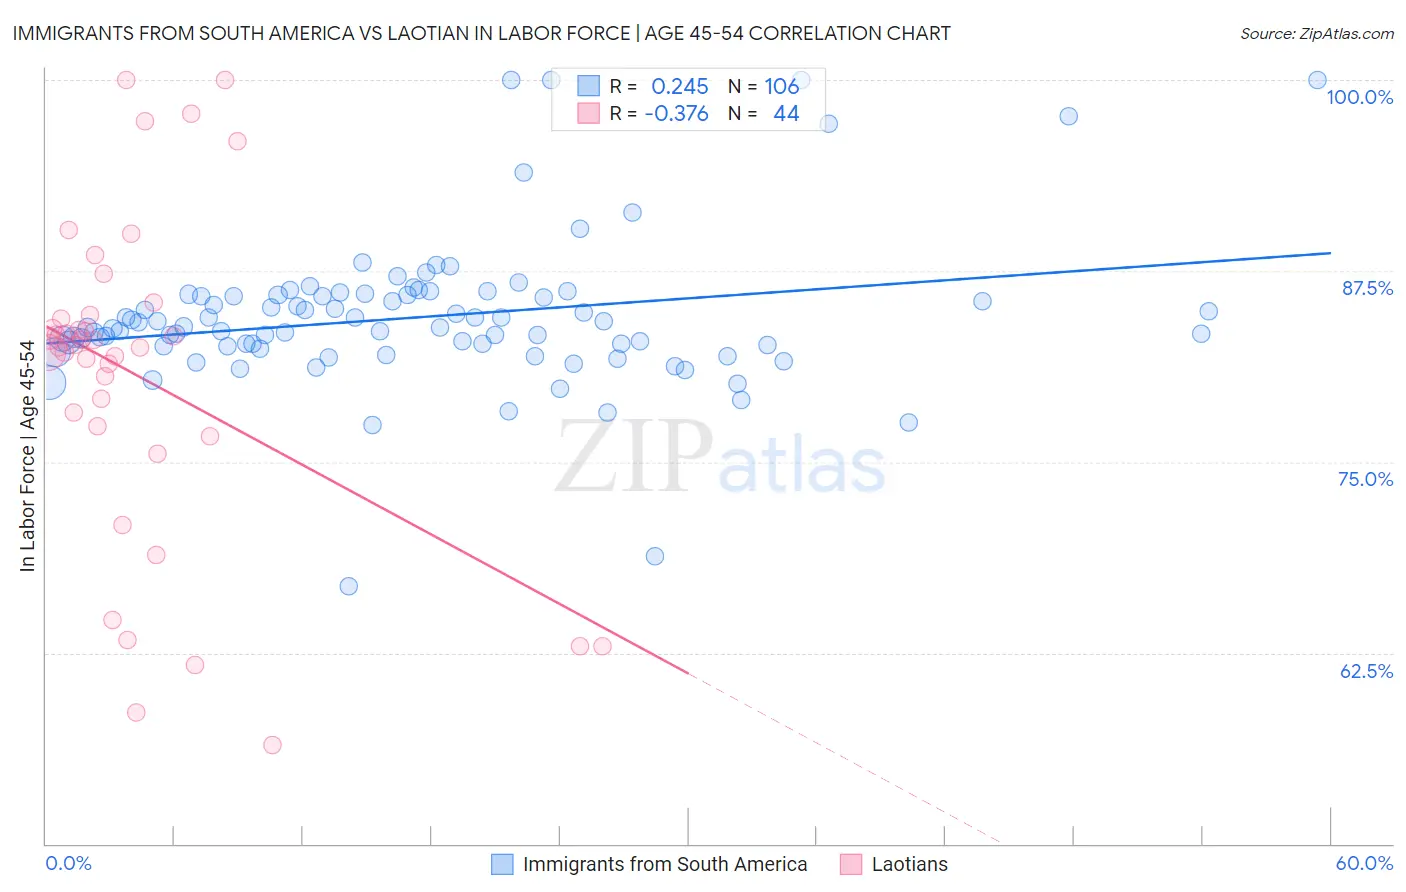
Immigrants from South America vs Laotian In Labor Force | Age 45-54 Correlation Chart
The statistical analysis conducted on geographies consisting of 486,007,786 people shows a weak positive correlation between the proportion of Immigrants from South America and labor force participation rate among population between the ages 45 and 54 in the United States with a correlation coefficient (R) of 0.245 and weighted average of 83.2%. Similarly, the statistical analysis conducted on geographies consisting of 224,742,074 people shows a mild negative correlation between the proportion of Laotians and labor force participation rate among population between the ages 45 and 54 in the United States with a correlation coefficient (R) of -0.376 and weighted average of 82.9%, a difference of 0.47%.
In Labor Force | Age 45-54 Correlation Summary
| Measurement | Immigrants from South America | Laotian |
| Minimum | 66.9% | 56.5% |
| Maximum | 100.0% | 100.0% |
| Range | 33.1% | 43.5% |
| Mean | 84.5% | 80.6% |
| Median | 83.8% | 82.6% |
| Interquartile 25% (IQ1) | 82.6% | 77.0% |
| Interquartile 75% (IQ3) | 85.9% | 84.5% |
| Interquartile Range (IQR) | 3.3% | 7.5% |
| Standard Deviation (Sample) | 4.9% | 10.7% |
| Standard Deviation (Population) | 4.9% | 10.5% |
Similar Demographics by In Labor Force | Age 45-54
Demographics Similar to Immigrants from South America by In Labor Force | Age 45-54
In terms of in labor force | age 45-54, the demographic groups most similar to Immigrants from South America are Immigrants from Singapore (83.3%, a difference of 0.010%), Albanian (83.3%, a difference of 0.010%), Immigrants from Romania (83.3%, a difference of 0.010%), Sri Lankan (83.2%, a difference of 0.010%), and Immigrants from Belarus (83.3%, a difference of 0.020%).
| Demographics | Rating | Rank | In Labor Force | Age 45-54 |
| Maltese | 94.4 /100 | #98 | Exceptional 83.3% |
| Immigrants | Middle Africa | 94.3 /100 | #99 | Exceptional 83.3% |
| Mongolians | 94.2 /100 | #100 | Exceptional 83.3% |
| Immigrants | Belarus | 94.1 /100 | #101 | Exceptional 83.3% |
| Immigrants | Singapore | 93.9 /100 | #102 | Exceptional 83.3% |
| Albanians | 93.9 /100 | #103 | Exceptional 83.3% |
| Immigrants | Romania | 93.8 /100 | #104 | Exceptional 83.3% |
| Immigrants | South America | 93.5 /100 | #105 | Exceptional 83.2% |
| Sri Lankans | 93.2 /100 | #106 | Exceptional 83.2% |
| Iranians | 92.9 /100 | #107 | Exceptional 83.2% |
| Slovaks | 92.8 /100 | #108 | Exceptional 83.2% |
| Ukrainians | 92.7 /100 | #109 | Exceptional 83.2% |
| Immigrants | Africa | 92.6 /100 | #110 | Exceptional 83.2% |
| Immigrants | Italy | 92.5 /100 | #111 | Exceptional 83.2% |
| Immigrants | Afghanistan | 92.4 /100 | #112 | Exceptional 83.2% |
Demographics Similar to Laotians by In Labor Force | Age 45-54
In terms of in labor force | age 45-54, the demographic groups most similar to Laotians are South American Indian (82.9%, a difference of 0.010%), Haitian (82.8%, a difference of 0.010%), Dutch (82.8%, a difference of 0.010%), German Russian (82.8%, a difference of 0.010%), and Immigrants from Austria (82.9%, a difference of 0.020%).
| Demographics | Rating | Rank | In Labor Force | Age 45-54 |
| Immigrants | Indonesia | 70.6 /100 | #153 | Good 82.9% |
| Immigrants | Ghana | 70.3 /100 | #154 | Good 82.9% |
| Immigrants | Philippines | 69.0 /100 | #155 | Good 82.9% |
| Immigrants | Saudi Arabia | 68.8 /100 | #156 | Good 82.9% |
| Immigrants | Australia | 68.2 /100 | #157 | Good 82.9% |
| Immigrants | Southern Europe | 67.8 /100 | #158 | Good 82.9% |
| Immigrants | Austria | 64.6 /100 | #159 | Good 82.9% |
| Laotians | 62.8 /100 | #160 | Good 82.9% |
| South American Indians | 62.2 /100 | #161 | Good 82.9% |
| Haitians | 61.8 /100 | #162 | Good 82.8% |
| Dutch | 61.7 /100 | #163 | Good 82.8% |
| German Russians | 61.3 /100 | #164 | Good 82.8% |
| Immigrants | Sudan | 59.9 /100 | #165 | Average 82.8% |
| Immigrants | South Eastern Asia | 57.4 /100 | #166 | Average 82.8% |
| Swiss | 56.5 /100 | #167 | Average 82.8% |