Immigrants from Armenia vs Laotian In Labor Force | Age 45-54
COMPARE
Immigrants from Armenia
Laotian
In Labor Force | Age 45-54
In Labor Force | Age 45-54 Comparison
Immigrants from Armenia
Laotians
81.7%
IN LABOR FORCE | AGE 45-54
0.2/ 100
METRIC RATING
250th/ 347
METRIC RANK
82.9%
IN LABOR FORCE | AGE 45-54
62.8/ 100
METRIC RATING
160th/ 347
METRIC RANK
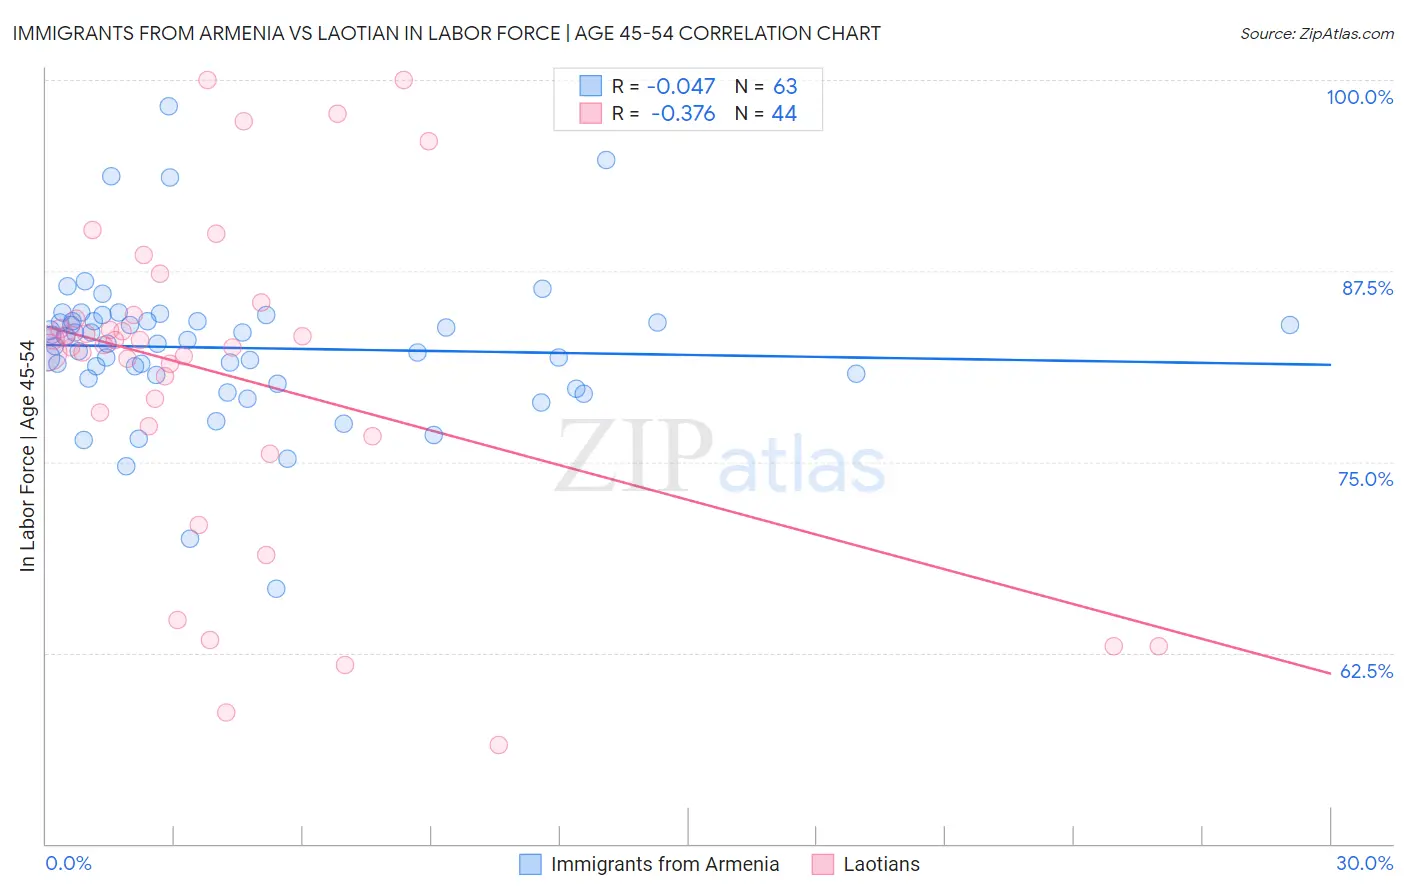
Immigrants from Armenia vs Laotian In Labor Force | Age 45-54 Correlation Chart
The statistical analysis conducted on geographies consisting of 97,712,930 people shows no correlation between the proportion of Immigrants from Armenia and labor force participation rate among population between the ages 45 and 54 in the United States with a correlation coefficient (R) of -0.047 and weighted average of 81.7%. Similarly, the statistical analysis conducted on geographies consisting of 224,742,074 people shows a mild negative correlation between the proportion of Laotians and labor force participation rate among population between the ages 45 and 54 in the United States with a correlation coefficient (R) of -0.376 and weighted average of 82.9%, a difference of 1.5%.
In Labor Force | Age 45-54 Correlation Summary
| Measurement | Immigrants from Armenia | Laotian |
| Minimum | 66.7% | 56.5% |
| Maximum | 98.3% | 100.0% |
| Range | 31.6% | 43.5% |
| Mean | 82.5% | 80.6% |
| Median | 82.7% | 82.6% |
| Interquartile 25% (IQ1) | 80.4% | 77.0% |
| Interquartile 75% (IQ3) | 84.2% | 84.5% |
| Interquartile Range (IQR) | 3.8% | 7.5% |
| Standard Deviation (Sample) | 4.9% | 10.7% |
| Standard Deviation (Population) | 4.9% | 10.5% |
Similar Demographics by In Labor Force | Age 45-54
Demographics Similar to Immigrants from Armenia by In Labor Force | Age 45-54
In terms of in labor force | age 45-54, the demographic groups most similar to Immigrants from Armenia are Guamanian/Chamorro (81.6%, a difference of 0.020%), Pennsylvania German (81.6%, a difference of 0.040%), Hmong (81.7%, a difference of 0.050%), Puget Sound Salish (81.7%, a difference of 0.070%), and Japanese (81.6%, a difference of 0.070%).
| Demographics | Rating | Rank | In Labor Force | Age 45-54 |
| Samoans | 0.6 /100 | #243 | Tragic 81.8% |
| Celtics | 0.4 /100 | #244 | Tragic 81.8% |
| Alaska Natives | 0.4 /100 | #245 | Tragic 81.8% |
| Alaskan Athabascans | 0.4 /100 | #246 | Tragic 81.8% |
| Central Americans | 0.4 /100 | #247 | Tragic 81.7% |
| Puget Sound Salish | 0.3 /100 | #248 | Tragic 81.7% |
| Hmong | 0.3 /100 | #249 | Tragic 81.7% |
| Immigrants | Armenia | 0.2 /100 | #250 | Tragic 81.7% |
| Guamanians/Chamorros | 0.2 /100 | #251 | Tragic 81.6% |
| Pennsylvania Germans | 0.2 /100 | #252 | Tragic 81.6% |
| Japanese | 0.2 /100 | #253 | Tragic 81.6% |
| Immigrants | Laos | 0.2 /100 | #254 | Tragic 81.6% |
| Scotch-Irish | 0.2 /100 | #255 | Tragic 81.6% |
| Barbadians | 0.1 /100 | #256 | Tragic 81.6% |
| Immigrants | Congo | 0.1 /100 | #257 | Tragic 81.6% |
Demographics Similar to Laotians by In Labor Force | Age 45-54
In terms of in labor force | age 45-54, the demographic groups most similar to Laotians are South American Indian (82.9%, a difference of 0.010%), Haitian (82.8%, a difference of 0.010%), Dutch (82.8%, a difference of 0.010%), German Russian (82.8%, a difference of 0.010%), and Immigrants from Austria (82.9%, a difference of 0.020%).
| Demographics | Rating | Rank | In Labor Force | Age 45-54 |
| Immigrants | Indonesia | 70.6 /100 | #153 | Good 82.9% |
| Immigrants | Ghana | 70.3 /100 | #154 | Good 82.9% |
| Immigrants | Philippines | 69.0 /100 | #155 | Good 82.9% |
| Immigrants | Saudi Arabia | 68.8 /100 | #156 | Good 82.9% |
| Immigrants | Australia | 68.2 /100 | #157 | Good 82.9% |
| Immigrants | Southern Europe | 67.8 /100 | #158 | Good 82.9% |
| Immigrants | Austria | 64.6 /100 | #159 | Good 82.9% |
| Laotians | 62.8 /100 | #160 | Good 82.9% |
| South American Indians | 62.2 /100 | #161 | Good 82.9% |
| Haitians | 61.8 /100 | #162 | Good 82.8% |
| Dutch | 61.7 /100 | #163 | Good 82.8% |
| German Russians | 61.3 /100 | #164 | Good 82.8% |
| Immigrants | Sudan | 59.9 /100 | #165 | Average 82.8% |
| Immigrants | South Eastern Asia | 57.4 /100 | #166 | Average 82.8% |
| Swiss | 56.5 /100 | #167 | Average 82.8% |