Immigrants from Switzerland vs Immigrants from Bulgaria In Labor Force | Age 30-34
COMPARE
Immigrants from Switzerland
Immigrants from Bulgaria
In Labor Force | Age 30-34
In Labor Force | Age 30-34 Comparison
Immigrants from Switzerland
Immigrants from Bulgaria
85.3%
IN LABOR FORCE | AGE 30-34
98.7/ 100
METRIC RATING
79th/ 347
METRIC RANK
86.0%
IN LABOR FORCE | AGE 30-34
100.0/ 100
METRIC RATING
21st/ 347
METRIC RANK
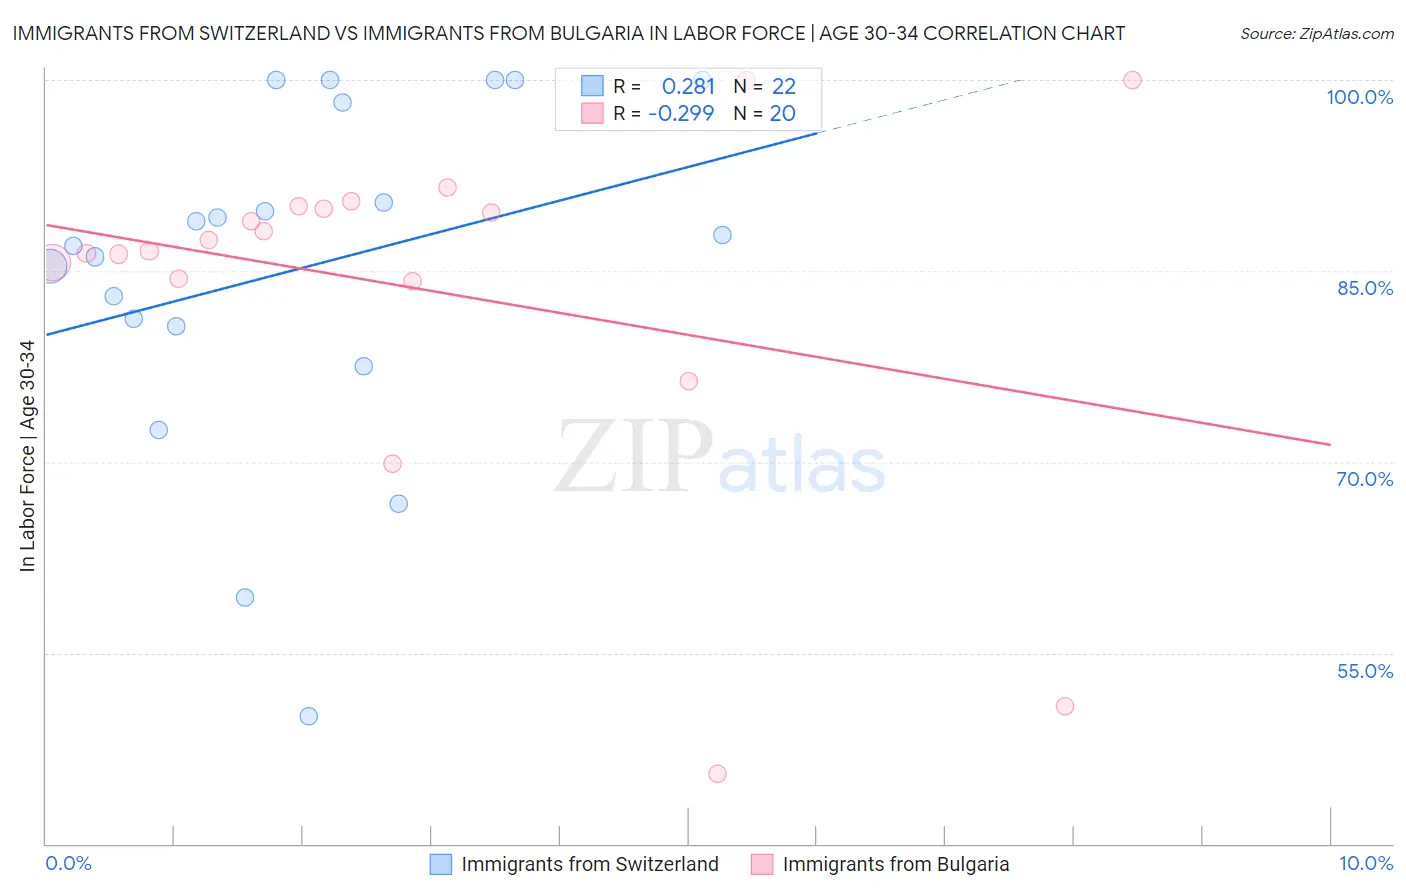
Immigrants from Switzerland vs Immigrants from Bulgaria In Labor Force | Age 30-34 Correlation Chart
The statistical analysis conducted on geographies consisting of 148,037,951 people shows a weak positive correlation between the proportion of Immigrants from Switzerland and labor force participation rate among population between the ages 30 and 34 in the United States with a correlation coefficient (R) of 0.281 and weighted average of 85.3%. Similarly, the statistical analysis conducted on geographies consisting of 172,547,682 people shows a weak negative correlation between the proportion of Immigrants from Bulgaria and labor force participation rate among population between the ages 30 and 34 in the United States with a correlation coefficient (R) of -0.299 and weighted average of 86.0%, a difference of 0.74%.
In Labor Force | Age 30-34 Correlation Summary
| Measurement | Immigrants from Switzerland | Immigrants from Bulgaria |
| Minimum | 50.0% | 45.5% |
| Maximum | 100.0% | 100.0% |
| Range | 50.0% | 54.5% |
| Mean | 85.2% | 83.6% |
| Median | 87.4% | 87.0% |
| Interquartile 25% (IQ1) | 80.6% | 84.3% |
| Interquartile 75% (IQ3) | 98.2% | 90.0% |
| Interquartile Range (IQR) | 17.6% | 5.7% |
| Standard Deviation (Sample) | 13.6% | 13.8% |
| Standard Deviation (Population) | 13.2% | 13.5% |
Similar Demographics by In Labor Force | Age 30-34
Demographics Similar to Immigrants from Switzerland by In Labor Force | Age 30-34
In terms of in labor force | age 30-34, the demographic groups most similar to Immigrants from Switzerland are Immigrants from Russia (85.3%, a difference of 0.0%), Immigrants from Singapore (85.3%, a difference of 0.010%), Slovak (85.3%, a difference of 0.010%), Immigrants from Africa (85.3%, a difference of 0.010%), and Immigrants from Europe (85.3%, a difference of 0.020%).
| Demographics | Rating | Rank | In Labor Force | Age 30-34 |
| Immigrants | China | 99.0 /100 | #72 | Exceptional 85.4% |
| Indians (Asian) | 99.0 /100 | #73 | Exceptional 85.4% |
| Maltese | 99.0 /100 | #74 | Exceptional 85.4% |
| Immigrants | Czechoslovakia | 99.0 /100 | #75 | Exceptional 85.4% |
| Iranians | 99.0 /100 | #76 | Exceptional 85.4% |
| Immigrants | Eastern Asia | 98.9 /100 | #77 | Exceptional 85.4% |
| Immigrants | Singapore | 98.8 /100 | #78 | Exceptional 85.3% |
| Immigrants | Switzerland | 98.7 /100 | #79 | Exceptional 85.3% |
| Immigrants | Russia | 98.7 /100 | #80 | Exceptional 85.3% |
| Slovaks | 98.7 /100 | #81 | Exceptional 85.3% |
| Immigrants | Africa | 98.6 /100 | #82 | Exceptional 85.3% |
| Immigrants | Europe | 98.6 /100 | #83 | Exceptional 85.3% |
| Greeks | 98.6 /100 | #84 | Exceptional 85.3% |
| Mongolians | 98.5 /100 | #85 | Exceptional 85.3% |
| Immigrants | Taiwan | 98.3 /100 | #86 | Exceptional 85.3% |
Demographics Similar to Immigrants from Bulgaria by In Labor Force | Age 30-34
In terms of in labor force | age 30-34, the demographic groups most similar to Immigrants from Bulgaria are Bulgarian (86.0%, a difference of 0.0%), Sierra Leonean (86.0%, a difference of 0.010%), Bermudan (85.9%, a difference of 0.020%), Estonian (85.9%, a difference of 0.030%), and Immigrants from Eritrea (85.9%, a difference of 0.040%).
| Demographics | Rating | Rank | In Labor Force | Age 30-34 |
| Immigrants | Cabo Verde | 100.0 /100 | #14 | Exceptional 86.1% |
| Immigrants | Albania | 100.0 /100 | #15 | Exceptional 86.1% |
| Latvians | 100.0 /100 | #16 | Exceptional 86.0% |
| Immigrants | Cameroon | 100.0 /100 | #17 | Exceptional 86.0% |
| Immigrants | Sierra Leone | 100.0 /100 | #18 | Exceptional 86.0% |
| Sierra Leoneans | 100.0 /100 | #19 | Exceptional 86.0% |
| Bulgarians | 100.0 /100 | #20 | Exceptional 86.0% |
| Immigrants | Bulgaria | 100.0 /100 | #21 | Exceptional 86.0% |
| Bermudans | 100.0 /100 | #22 | Exceptional 85.9% |
| Estonians | 100.0 /100 | #23 | Exceptional 85.9% |
| Immigrants | Eritrea | 100.0 /100 | #24 | Exceptional 85.9% |
| Immigrants | North Macedonia | 100.0 /100 | #25 | Exceptional 85.9% |
| Immigrants | Eastern Africa | 100.0 /100 | #26 | Exceptional 85.9% |
| Immigrants | Liberia | 100.0 /100 | #27 | Exceptional 85.9% |
| Immigrants | Latvia | 100.0 /100 | #28 | Exceptional 85.9% |