Immigrants from Switzerland vs Assyrian/Chaldean/Syriac Cognitive Disability
COMPARE
Immigrants from Switzerland
Assyrian/Chaldean/Syriac
Cognitive Disability
Cognitive Disability Comparison
Immigrants from Switzerland
Assyrians/Chaldeans/Syriacs
17.2%
COGNITIVE DISABILITY
71.5/ 100
METRIC RATING
163rd/ 347
METRIC RANK
16.2%
COGNITIVE DISABILITY
100.0/ 100
METRIC RATING
9th/ 347
METRIC RANK
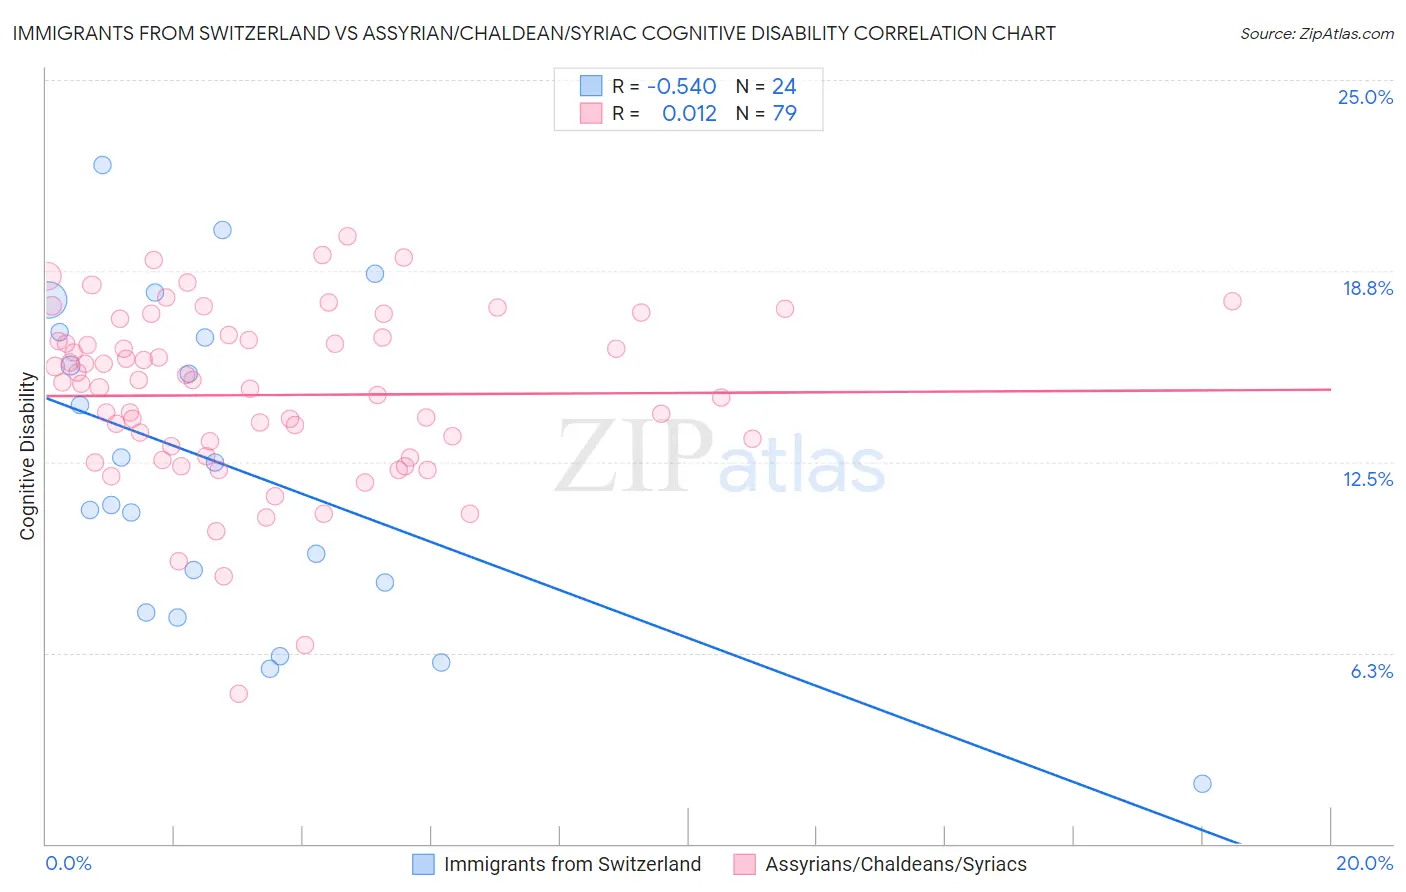
Immigrants from Switzerland vs Assyrian/Chaldean/Syriac Cognitive Disability Correlation Chart
The statistical analysis conducted on geographies consisting of 148,077,792 people shows a substantial negative correlation between the proportion of Immigrants from Switzerland and percentage of population with cognitive disability in the United States with a correlation coefficient (R) of -0.540 and weighted average of 17.2%. Similarly, the statistical analysis conducted on geographies consisting of 110,310,504 people shows no correlation between the proportion of Assyrians/Chaldeans/Syriacs and percentage of population with cognitive disability in the United States with a correlation coefficient (R) of 0.012 and weighted average of 16.2%, a difference of 6.0%.
Cognitive Disability Correlation Summary
| Measurement | Immigrants from Switzerland | Assyrian/Chaldean/Syriac |
| Minimum | 2.0% | 4.9% |
| Maximum | 22.2% | 19.9% |
| Range | 20.3% | 15.0% |
| Mean | 12.3% | 14.7% |
| Median | 11.8% | 15.1% |
| Interquartile 25% (IQ1) | 8.0% | 12.7% |
| Interquartile 75% (IQ3) | 16.7% | 16.6% |
| Interquartile Range (IQR) | 8.6% | 3.9% |
| Standard Deviation (Sample) | 5.3% | 2.9% |
| Standard Deviation (Population) | 5.2% | 2.8% |
Similar Demographics by Cognitive Disability
Demographics Similar to Immigrants from Switzerland by Cognitive Disability
In terms of cognitive disability, the demographic groups most similar to Immigrants from Switzerland are Yugoslavian (17.2%, a difference of 0.0%), American (17.2%, a difference of 0.020%), Australian (17.2%, a difference of 0.030%), Armenian (17.2%, a difference of 0.050%), and Immigrants from Latvia (17.2%, a difference of 0.060%).
| Demographics | Rating | Rank | Cognitive Disability |
| Sri Lankans | 78.9 /100 | #156 | Good 17.1% |
| Immigrants | Australia | 76.0 /100 | #157 | Good 17.1% |
| Celtics | 74.1 /100 | #158 | Good 17.1% |
| Immigrants | Latvia | 73.2 /100 | #159 | Good 17.2% |
| Australians | 72.4 /100 | #160 | Good 17.2% |
| Americans | 72.2 /100 | #161 | Good 17.2% |
| Yugoslavians | 71.6 /100 | #162 | Good 17.2% |
| Immigrants | Switzerland | 71.5 /100 | #163 | Good 17.2% |
| Armenians | 70.1 /100 | #164 | Good 17.2% |
| Immigrants | Albania | 64.9 /100 | #165 | Good 17.2% |
| Immigrants | Ecuador | 64.4 /100 | #166 | Good 17.2% |
| Immigrants | Syria | 63.5 /100 | #167 | Good 17.2% |
| Immigrants | Immigrants | 62.5 /100 | #168 | Good 17.2% |
| Immigrants | Portugal | 61.8 /100 | #169 | Good 17.2% |
| Ecuadorians | 59.6 /100 | #170 | Average 17.2% |
Demographics Similar to Assyrians/Chaldeans/Syriacs by Cognitive Disability
In terms of cognitive disability, the demographic groups most similar to Assyrians/Chaldeans/Syriacs are Immigrants from Scotland (16.2%, a difference of 0.040%), Immigrants from Czechoslovakia (16.2%, a difference of 0.13%), Maltese (16.2%, a difference of 0.29%), Immigrants from Poland (16.1%, a difference of 0.32%), and Immigrants from Ireland (16.1%, a difference of 0.34%).
| Demographics | Rating | Rank | Cognitive Disability |
| Immigrants | India | 100.0 /100 | #2 | Exceptional 15.9% |
| Chinese | 100.0 /100 | #3 | Exceptional 15.9% |
| Immigrants | Lithuania | 100.0 /100 | #4 | Exceptional 16.0% |
| Immigrants | Hong Kong | 100.0 /100 | #5 | Exceptional 16.0% |
| Thais | 100.0 /100 | #6 | Exceptional 16.1% |
| Immigrants | Ireland | 100.0 /100 | #7 | Exceptional 16.1% |
| Immigrants | Poland | 100.0 /100 | #8 | Exceptional 16.1% |
| Assyrians/Chaldeans/Syriacs | 100.0 /100 | #9 | Exceptional 16.2% |
| Immigrants | Scotland | 100.0 /100 | #10 | Exceptional 16.2% |
| Immigrants | Czechoslovakia | 100.0 /100 | #11 | Exceptional 16.2% |
| Maltese | 100.0 /100 | #12 | Exceptional 16.2% |
| Lithuanians | 100.0 /100 | #13 | Exceptional 16.3% |
| Immigrants | Austria | 100.0 /100 | #14 | Exceptional 16.3% |
| Immigrants | Greece | 100.0 /100 | #15 | Exceptional 16.3% |
| Eastern Europeans | 100.0 /100 | #16 | Exceptional 16.3% |