Immigrants from Sweden vs Yugoslavian In Labor Force | Age 16-19
COMPARE
Immigrants from Sweden
Yugoslavian
In Labor Force | Age 16-19
In Labor Force | Age 16-19 Comparison
Immigrants from Sweden
Yugoslavians
35.9%
IN LABOR FORCE | AGE 16-19
18.8/ 100
METRIC RATING
200th/ 347
METRIC RANK
41.8%
IN LABOR FORCE | AGE 16-19
100.0/ 100
METRIC RATING
35th/ 347
METRIC RANK
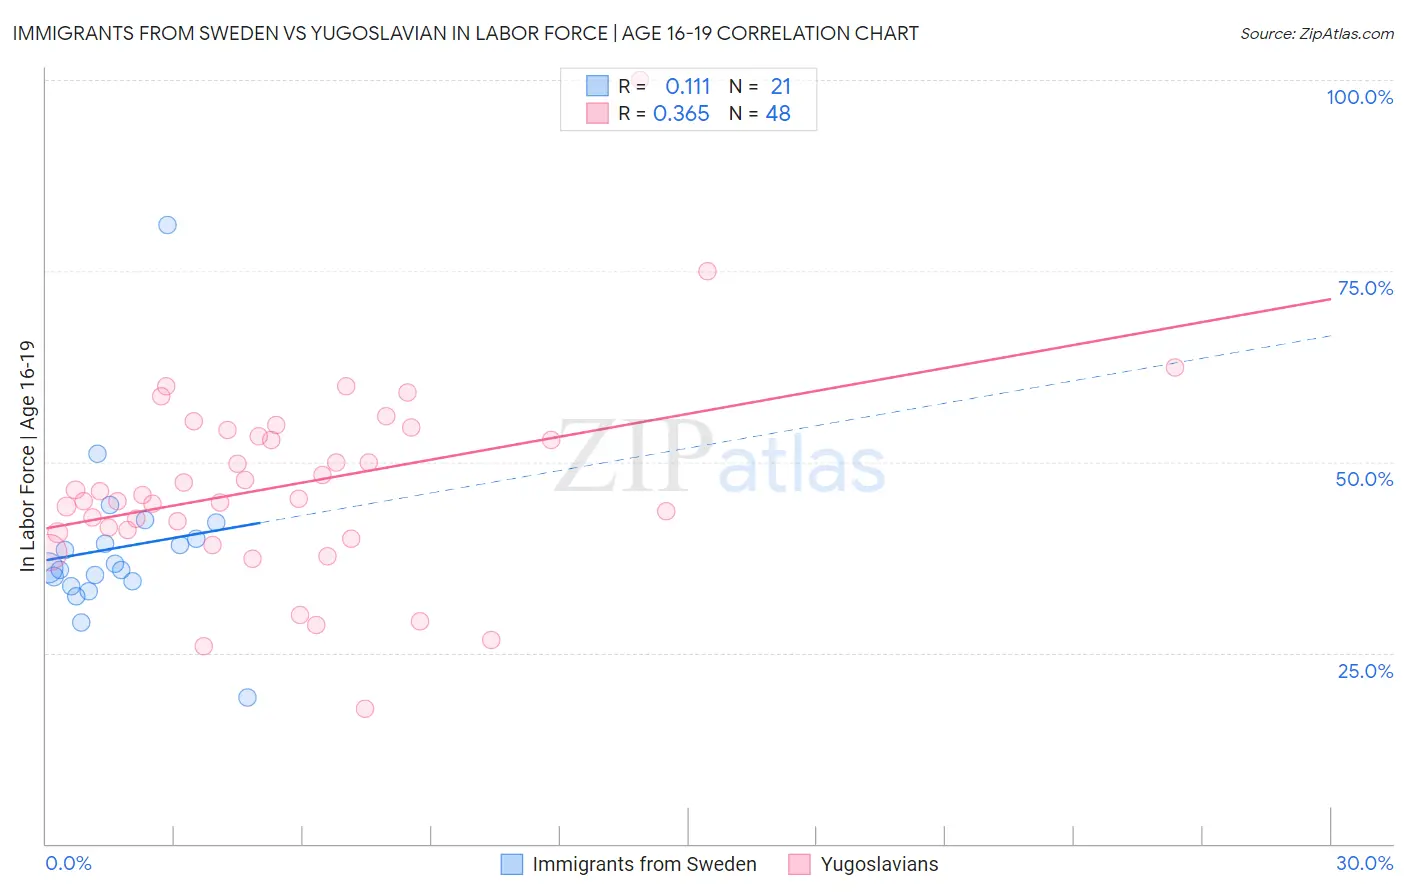
Immigrants from Sweden vs Yugoslavian In Labor Force | Age 16-19 Correlation Chart
The statistical analysis conducted on geographies consisting of 164,543,738 people shows a poor positive correlation between the proportion of Immigrants from Sweden and labor force participation rate among population between the ages 16 and 19 in the United States with a correlation coefficient (R) of 0.111 and weighted average of 35.9%. Similarly, the statistical analysis conducted on geographies consisting of 285,420,048 people shows a mild positive correlation between the proportion of Yugoslavians and labor force participation rate among population between the ages 16 and 19 in the United States with a correlation coefficient (R) of 0.365 and weighted average of 41.8%, a difference of 16.4%.
In Labor Force | Age 16-19 Correlation Summary
| Measurement | Immigrants from Sweden | Yugoslavian |
| Minimum | 19.1% | 17.7% |
| Maximum | 81.0% | 100.0% |
| Range | 61.9% | 82.3% |
| Mean | 38.8% | 46.9% |
| Median | 36.1% | 45.4% |
| Interquartile 25% (IQ1) | 34.0% | 40.9% |
| Interquartile 75% (IQ3) | 41.0% | 53.8% |
| Interquartile Range (IQR) | 7.0% | 12.9% |
| Standard Deviation (Sample) | 11.5% | 13.2% |
| Standard Deviation (Population) | 11.2% | 13.0% |
Similar Demographics by In Labor Force | Age 16-19
Demographics Similar to Immigrants from Sweden by In Labor Force | Age 16-19
In terms of in labor force | age 16-19, the demographic groups most similar to Immigrants from Sweden are Immigrants from Norway (35.9%, a difference of 0.080%), Immigrants from Northern Africa (35.9%, a difference of 0.090%), Alsatian (35.9%, a difference of 0.12%), Senegalese (35.9%, a difference of 0.12%), and Immigrants from Serbia (36.0%, a difference of 0.17%).
| Demographics | Rating | Rank | In Labor Force | Age 16-19 |
| Immigrants | Denmark | 25.0 /100 | #193 | Fair 36.1% |
| Nigerians | 24.6 /100 | #194 | Fair 36.1% |
| Bolivians | 23.3 /100 | #195 | Fair 36.0% |
| Mexican American Indians | 21.1 /100 | #196 | Fair 36.0% |
| Immigrants | Serbia | 21.0 /100 | #197 | Fair 36.0% |
| Immigrants | Northern Africa | 19.9 /100 | #198 | Poor 35.9% |
| Immigrants | Norway | 19.8 /100 | #199 | Poor 35.9% |
| Immigrants | Sweden | 18.8 /100 | #200 | Poor 35.9% |
| Alsatians | 17.5 /100 | #201 | Poor 35.9% |
| Senegalese | 17.4 /100 | #202 | Poor 35.9% |
| Immigrants | Nigeria | 16.8 /100 | #203 | Poor 35.8% |
| Immigrants | Albania | 15.0 /100 | #204 | Poor 35.8% |
| South American Indians | 14.6 /100 | #205 | Poor 35.8% |
| Chileans | 14.6 /100 | #206 | Poor 35.8% |
| Immigrants | Eastern Europe | 14.5 /100 | #207 | Poor 35.8% |
Demographics Similar to Yugoslavians by In Labor Force | Age 16-19
In terms of in labor force | age 16-19, the demographic groups most similar to Yugoslavians are Immigrants from Bosnia and Herzegovina (41.8%, a difference of 0.020%), Liberian (41.8%, a difference of 0.10%), Immigrants from the Azores (41.7%, a difference of 0.14%), Immigrants from Congo (41.7%, a difference of 0.22%), and Czechoslovakian (41.9%, a difference of 0.24%).
| Demographics | Rating | Rank | In Labor Force | Age 16-19 |
| Poles | 100.0 /100 | #28 | Exceptional 42.1% |
| French | 100.0 /100 | #29 | Exceptional 42.1% |
| Scottish | 100.0 /100 | #30 | Exceptional 42.0% |
| Irish | 100.0 /100 | #31 | Exceptional 42.0% |
| Czechoslovakians | 100.0 /100 | #32 | Exceptional 41.9% |
| Liberians | 100.0 /100 | #33 | Exceptional 41.8% |
| Immigrants | Bosnia and Herzegovina | 100.0 /100 | #34 | Exceptional 41.8% |
| Yugoslavians | 100.0 /100 | #35 | Exceptional 41.8% |
| Immigrants | Azores | 100.0 /100 | #36 | Exceptional 41.7% |
| Immigrants | Congo | 100.0 /100 | #37 | Exceptional 41.7% |
| Sioux | 100.0 /100 | #38 | Exceptional 41.5% |
| Scotch-Irish | 100.0 /100 | #39 | Exceptional 41.5% |
| Immigrants | Liberia | 100.0 /100 | #40 | Exceptional 41.5% |
| Celtics | 100.0 /100 | #41 | Exceptional 41.3% |
| Whites/Caucasians | 100.0 /100 | #42 | Exceptional 41.3% |