Immigrants from Sweden vs Immigrants from Western Europe In Labor Force | Age 16-19
COMPARE
Immigrants from Sweden
Immigrants from Western Europe
In Labor Force | Age 16-19
In Labor Force | Age 16-19 Comparison
Immigrants from Sweden
Immigrants from Western Europe
35.9%
IN LABOR FORCE | AGE 16-19
18.8/ 100
METRIC RATING
200th/ 347
METRIC RANK
37.5%
IN LABOR FORCE | AGE 16-19
88.9/ 100
METRIC RATING
146th/ 347
METRIC RANK
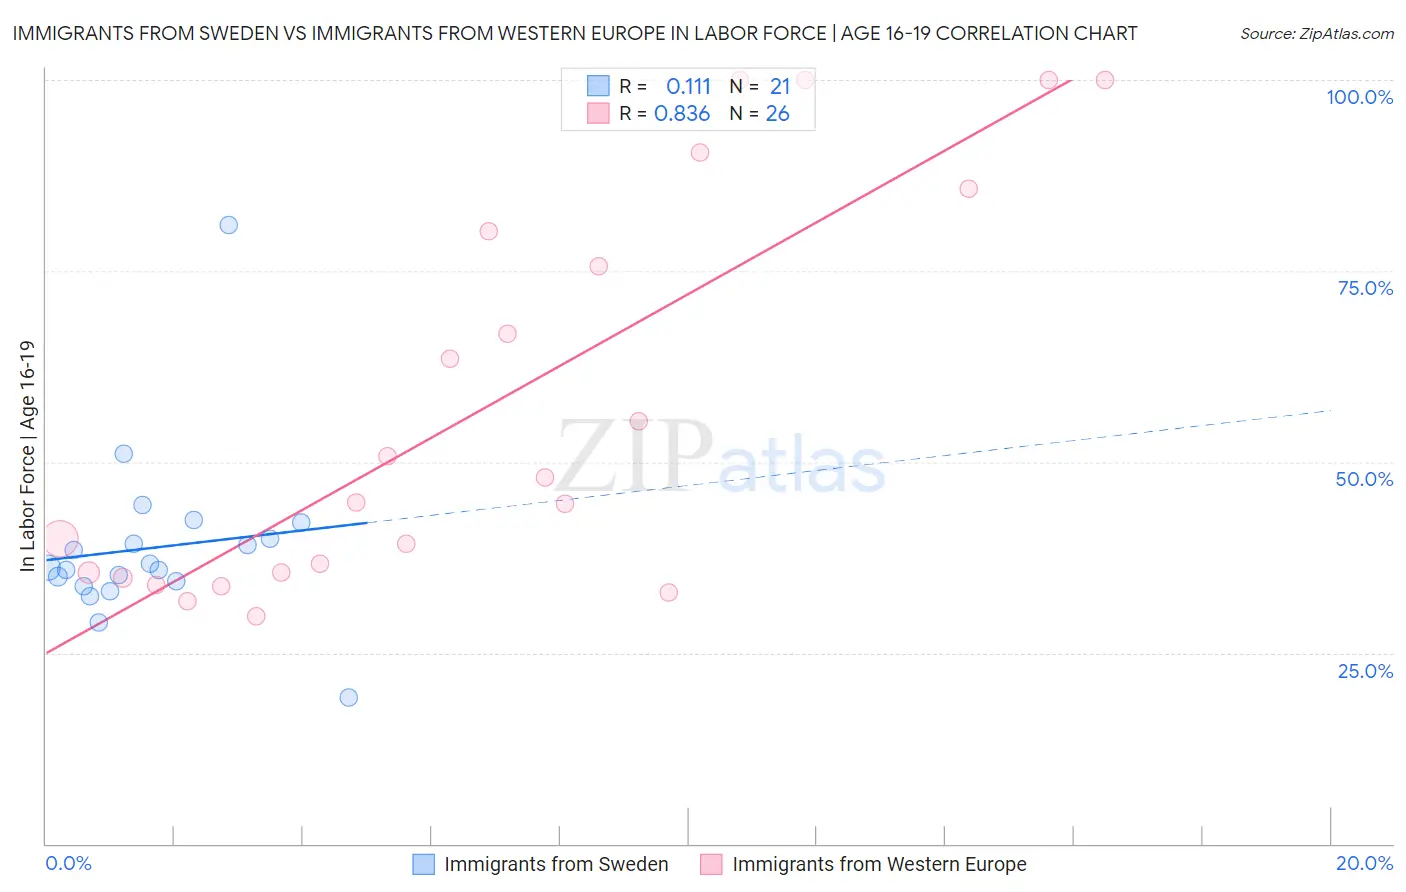
Immigrants from Sweden vs Immigrants from Western Europe In Labor Force | Age 16-19 Correlation Chart
The statistical analysis conducted on geographies consisting of 164,543,738 people shows a poor positive correlation between the proportion of Immigrants from Sweden and labor force participation rate among population between the ages 16 and 19 in the United States with a correlation coefficient (R) of 0.111 and weighted average of 35.9%. Similarly, the statistical analysis conducted on geographies consisting of 492,395,193 people shows a very strong positive correlation between the proportion of Immigrants from Western Europe and labor force participation rate among population between the ages 16 and 19 in the United States with a correlation coefficient (R) of 0.836 and weighted average of 37.5%, a difference of 4.5%.
In Labor Force | Age 16-19 Correlation Summary
| Measurement | Immigrants from Sweden | Immigrants from Western Europe |
| Minimum | 19.1% | 29.8% |
| Maximum | 81.0% | 100.0% |
| Range | 61.9% | 70.2% |
| Mean | 38.8% | 57.3% |
| Median | 36.1% | 46.3% |
| Interquartile 25% (IQ1) | 34.0% | 35.5% |
| Interquartile 75% (IQ3) | 41.0% | 80.2% |
| Interquartile Range (IQR) | 7.0% | 44.7% |
| Standard Deviation (Sample) | 11.5% | 25.5% |
| Standard Deviation (Population) | 11.2% | 25.0% |
Similar Demographics by In Labor Force | Age 16-19
Demographics Similar to Immigrants from Sweden by In Labor Force | Age 16-19
In terms of in labor force | age 16-19, the demographic groups most similar to Immigrants from Sweden are Immigrants from Norway (35.9%, a difference of 0.080%), Immigrants from Northern Africa (35.9%, a difference of 0.090%), Alsatian (35.9%, a difference of 0.12%), Senegalese (35.9%, a difference of 0.12%), and Immigrants from Serbia (36.0%, a difference of 0.17%).
| Demographics | Rating | Rank | In Labor Force | Age 16-19 |
| Immigrants | Denmark | 25.0 /100 | #193 | Fair 36.1% |
| Nigerians | 24.6 /100 | #194 | Fair 36.1% |
| Bolivians | 23.3 /100 | #195 | Fair 36.0% |
| Mexican American Indians | 21.1 /100 | #196 | Fair 36.0% |
| Immigrants | Serbia | 21.0 /100 | #197 | Fair 36.0% |
| Immigrants | Northern Africa | 19.9 /100 | #198 | Poor 35.9% |
| Immigrants | Norway | 19.8 /100 | #199 | Poor 35.9% |
| Immigrants | Sweden | 18.8 /100 | #200 | Poor 35.9% |
| Alsatians | 17.5 /100 | #201 | Poor 35.9% |
| Senegalese | 17.4 /100 | #202 | Poor 35.9% |
| Immigrants | Nigeria | 16.8 /100 | #203 | Poor 35.8% |
| Immigrants | Albania | 15.0 /100 | #204 | Poor 35.8% |
| South American Indians | 14.6 /100 | #205 | Poor 35.8% |
| Chileans | 14.6 /100 | #206 | Poor 35.8% |
| Immigrants | Eastern Europe | 14.5 /100 | #207 | Poor 35.8% |
Demographics Similar to Immigrants from Western Europe by In Labor Force | Age 16-19
In terms of in labor force | age 16-19, the demographic groups most similar to Immigrants from Western Europe are Brazilian (37.5%, a difference of 0.030%), Japanese (37.5%, a difference of 0.050%), Paiute (37.5%, a difference of 0.050%), Pakistani (37.6%, a difference of 0.070%), and Sierra Leonean (37.6%, a difference of 0.10%).
| Demographics | Rating | Rank | In Labor Force | Age 16-19 |
| Immigrants | Moldova | 91.9 /100 | #139 | Exceptional 37.7% |
| Estonians | 91.7 /100 | #140 | Exceptional 37.7% |
| Syrians | 90.7 /100 | #141 | Exceptional 37.6% |
| Sierra Leoneans | 89.7 /100 | #142 | Excellent 37.6% |
| Pakistanis | 89.5 /100 | #143 | Excellent 37.6% |
| Japanese | 89.3 /100 | #144 | Excellent 37.5% |
| Paiute | 89.3 /100 | #145 | Excellent 37.5% |
| Immigrants | Western Europe | 88.9 /100 | #146 | Excellent 37.5% |
| Brazilians | 88.7 /100 | #147 | Excellent 37.5% |
| Romanians | 87.3 /100 | #148 | Excellent 37.5% |
| Native Hawaiians | 85.0 /100 | #149 | Excellent 37.4% |
| Tsimshian | 84.7 /100 | #150 | Excellent 37.4% |
| Immigrants | Poland | 84.4 /100 | #151 | Excellent 37.3% |
| Immigrants | Sierra Leone | 83.6 /100 | #152 | Excellent 37.3% |
| Arapaho | 81.8 /100 | #153 | Excellent 37.3% |