Immigrants from Sweden vs Immigrants from Hungary 6th Grade
COMPARE
Immigrants from Sweden
Immigrants from Hungary
6th Grade
6th Grade Comparison
Immigrants from Sweden
Immigrants from Hungary
97.5%
6TH GRADE
98.6/ 100
METRIC RATING
97th/ 347
METRIC RANK
97.3%
6TH GRADE
89.5/ 100
METRIC RATING
135th/ 347
METRIC RANK
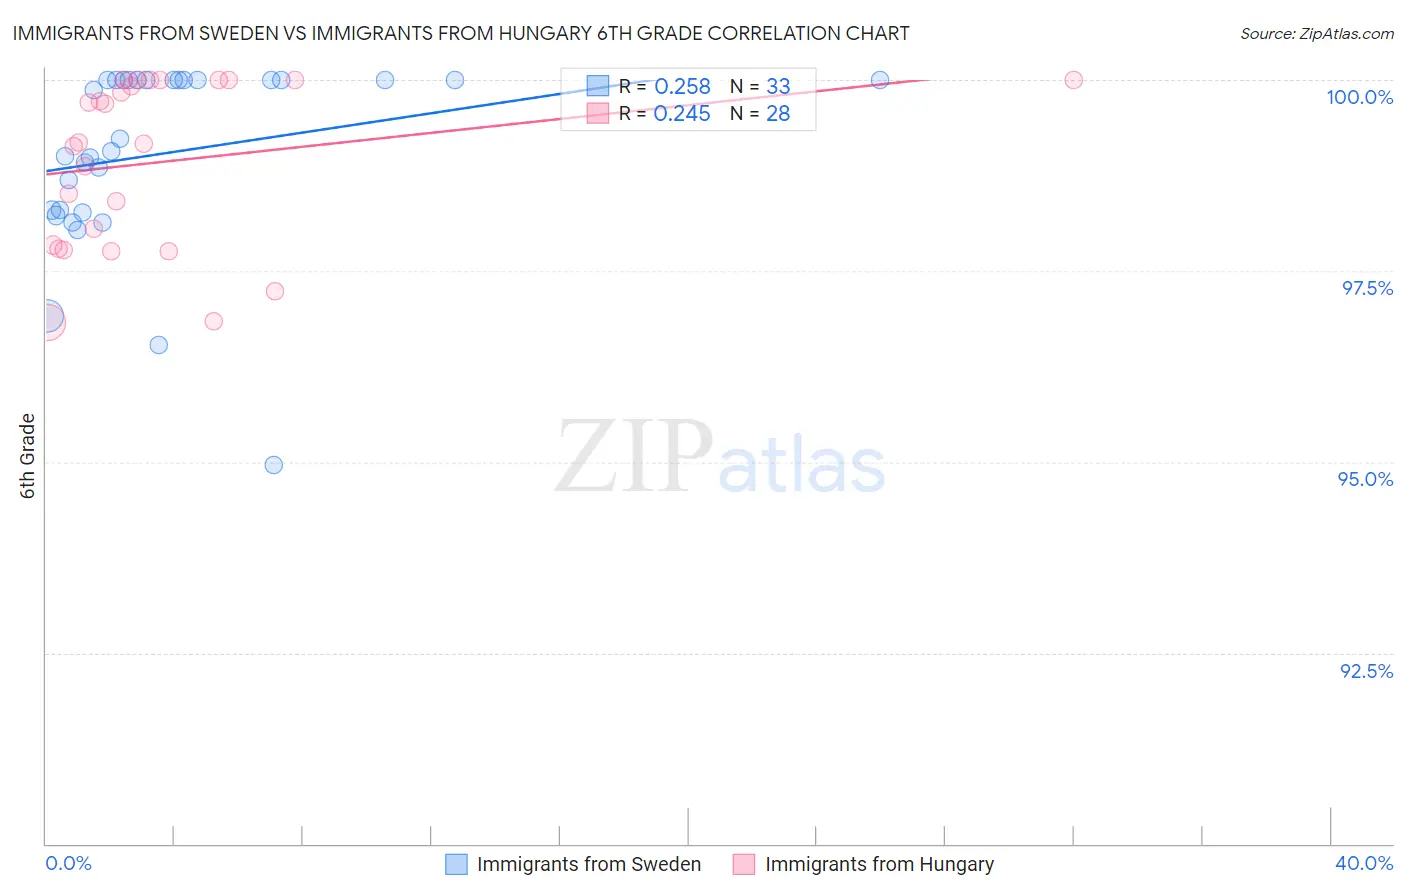
Immigrants from Sweden vs Immigrants from Hungary 6th Grade Correlation Chart
The statistical analysis conducted on geographies consisting of 164,737,092 people shows a weak positive correlation between the proportion of Immigrants from Sweden and percentage of population with at least 6th grade education in the United States with a correlation coefficient (R) of 0.258 and weighted average of 97.5%. Similarly, the statistical analysis conducted on geographies consisting of 195,707,305 people shows a weak positive correlation between the proportion of Immigrants from Hungary and percentage of population with at least 6th grade education in the United States with a correlation coefficient (R) of 0.245 and weighted average of 97.3%, a difference of 0.24%.
6th Grade Correlation Summary
| Measurement | Immigrants from Sweden | Immigrants from Hungary |
| Minimum | 95.0% | 96.8% |
| Maximum | 100.0% | 100.0% |
| Range | 5.0% | 3.2% |
| Mean | 99.0% | 98.9% |
| Median | 99.2% | 99.2% |
| Interquartile 25% (IQ1) | 98.3% | 97.8% |
| Interquartile 75% (IQ3) | 100.0% | 100.0% |
| Interquartile Range (IQR) | 1.7% | 2.2% |
| Standard Deviation (Sample) | 1.2% | 1.1% |
| Standard Deviation (Population) | 1.2% | 1.1% |
Similar Demographics by 6th Grade
Demographics Similar to Immigrants from Sweden by 6th Grade
In terms of 6th grade, the demographic groups most similar to Immigrants from Sweden are Cree (97.5%, a difference of 0.0%), Cypriot (97.5%, a difference of 0.0%), Immigrants from Ireland (97.5%, a difference of 0.0%), Immigrants from Germany (97.5%, a difference of 0.0%), and Pueblo (97.5%, a difference of 0.010%).
| Demographics | Rating | Rank | 6th Grade |
| Pueblo | 98.8 /100 | #90 | Exceptional 97.5% |
| Immigrants | Western Europe | 98.8 /100 | #91 | Exceptional 97.5% |
| Romanians | 98.7 /100 | #92 | Exceptional 97.5% |
| Cree | 98.7 /100 | #93 | Exceptional 97.5% |
| Cypriots | 98.7 /100 | #94 | Exceptional 97.5% |
| Immigrants | Ireland | 98.7 /100 | #95 | Exceptional 97.5% |
| Immigrants | Germany | 98.6 /100 | #96 | Exceptional 97.5% |
| Immigrants | Sweden | 98.6 /100 | #97 | Exceptional 97.5% |
| Immigrants | Denmark | 98.5 /100 | #98 | Exceptional 97.5% |
| Yugoslavians | 98.5 /100 | #99 | Exceptional 97.5% |
| Turks | 98.3 /100 | #100 | Exceptional 97.5% |
| South Africans | 98.2 /100 | #101 | Exceptional 97.5% |
| Choctaw | 98.0 /100 | #102 | Exceptional 97.5% |
| Bhutanese | 98.0 /100 | #103 | Exceptional 97.5% |
| German Russians | 97.9 /100 | #104 | Exceptional 97.5% |
Demographics Similar to Immigrants from Hungary by 6th Grade
In terms of 6th grade, the demographic groups most similar to Immigrants from Hungary are Immigrants from Kuwait (97.3%, a difference of 0.0%), Immigrants from Moldova (97.3%, a difference of 0.010%), Filipino (97.3%, a difference of 0.010%), Immigrants from Europe (97.3%, a difference of 0.020%), and Palestinian (97.3%, a difference of 0.020%).
| Demographics | Rating | Rank | 6th Grade |
| Immigrants | Romania | 92.0 /100 | #128 | Exceptional 97.3% |
| Immigrants | Serbia | 91.9 /100 | #129 | Exceptional 97.3% |
| Cambodians | 91.8 /100 | #130 | Exceptional 97.3% |
| Immigrants | Europe | 91.1 /100 | #131 | Exceptional 97.3% |
| Palestinians | 90.9 /100 | #132 | Exceptional 97.3% |
| Immigrants | Moldova | 90.0 /100 | #133 | Excellent 97.3% |
| Immigrants | Kuwait | 89.5 /100 | #134 | Excellent 97.3% |
| Immigrants | Hungary | 89.5 /100 | #135 | Excellent 97.3% |
| Filipinos | 88.9 /100 | #136 | Excellent 97.3% |
| Burmese | 87.8 /100 | #137 | Excellent 97.3% |
| Blackfeet | 87.7 /100 | #138 | Excellent 97.3% |
| Immigrants | Turkey | 86.1 /100 | #139 | Excellent 97.3% |
| Immigrants | North Macedonia | 85.5 /100 | #140 | Excellent 97.2% |
| Seminole | 84.8 /100 | #141 | Excellent 97.2% |
| Jordanians | 84.6 /100 | #142 | Excellent 97.2% |