Immigrants from Sweden vs Belizean In Labor Force | Age 20-64
COMPARE
Immigrants from Sweden
Belizean
In Labor Force | Age 20-64
In Labor Force | Age 20-64 Comparison
Immigrants from Sweden
Belizeans
79.8%
IN LABOR FORCE | AGE 20-64
79.7/ 100
METRIC RATING
143rd/ 347
METRIC RANK
78.2%
IN LABOR FORCE | AGE 20-64
0.0/ 100
METRIC RATING
279th/ 347
METRIC RANK
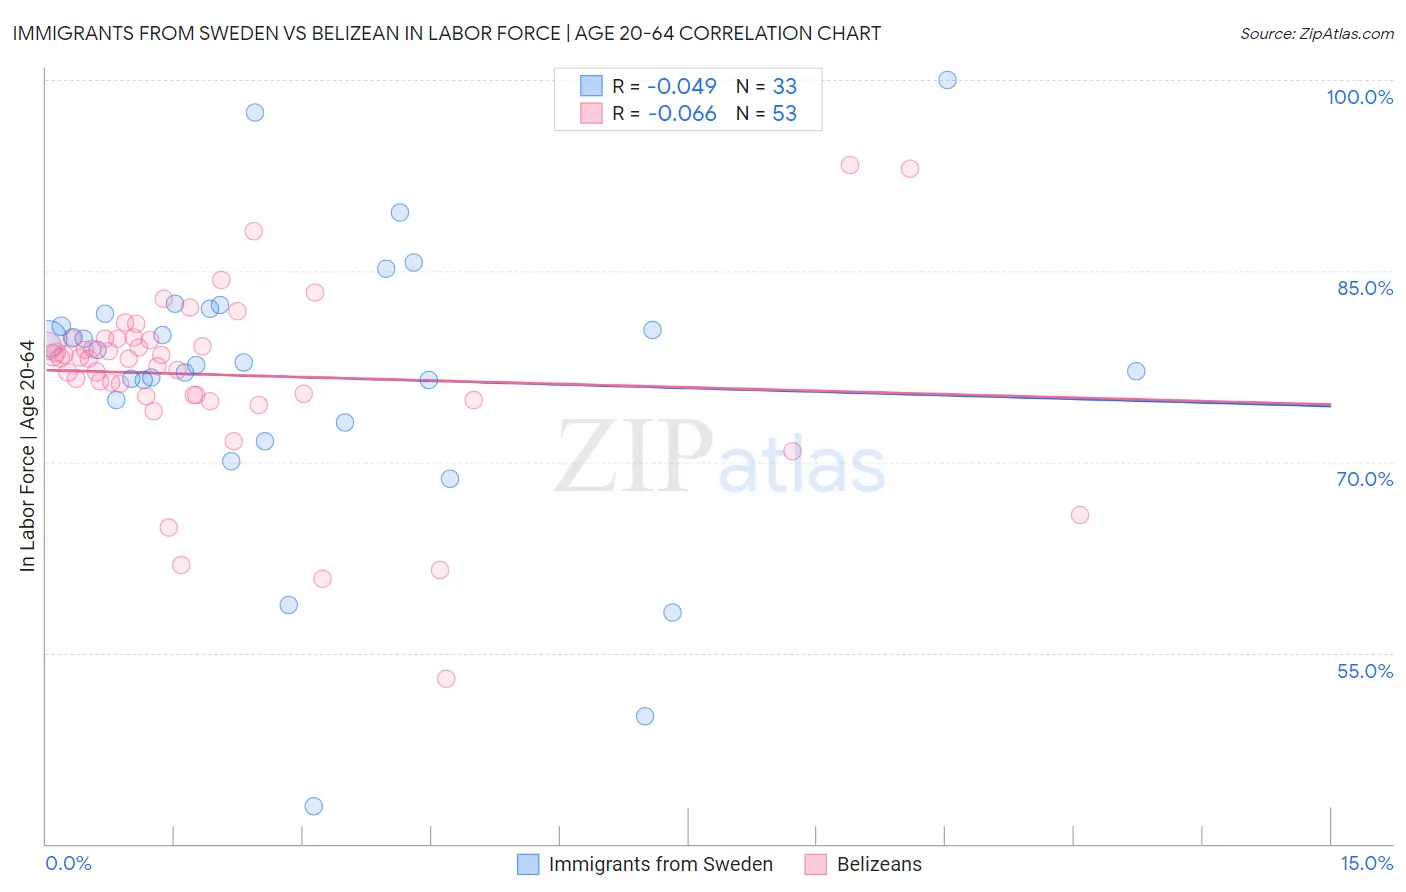
Immigrants from Sweden vs Belizean In Labor Force | Age 20-64 Correlation Chart
The statistical analysis conducted on geographies consisting of 164,749,668 people shows no correlation between the proportion of Immigrants from Sweden and labor force participation rate among population between the ages 20 and 64 in the United States with a correlation coefficient (R) of -0.049 and weighted average of 79.8%. Similarly, the statistical analysis conducted on geographies consisting of 144,213,246 people shows a slight negative correlation between the proportion of Belizeans and labor force participation rate among population between the ages 20 and 64 in the United States with a correlation coefficient (R) of -0.066 and weighted average of 78.2%, a difference of 2.1%.
In Labor Force | Age 20-64 Correlation Summary
| Measurement | Immigrants from Sweden | Belizean |
| Minimum | 42.9% | 53.0% |
| Maximum | 100.0% | 93.3% |
| Range | 57.1% | 40.3% |
| Mean | 76.6% | 76.8% |
| Median | 77.8% | 78.2% |
| Interquartile 25% (IQ1) | 74.0% | 75.2% |
| Interquartile 75% (IQ3) | 81.8% | 79.7% |
| Interquartile Range (IQR) | 7.8% | 4.5% |
| Standard Deviation (Sample) | 11.4% | 7.1% |
| Standard Deviation (Population) | 11.2% | 7.0% |
Similar Demographics by In Labor Force | Age 20-64
Demographics Similar to Immigrants from Sweden by In Labor Force | Age 20-64
In terms of in labor force | age 20-64, the demographic groups most similar to Immigrants from Sweden are Immigrants from Israel (79.8%, a difference of 0.0%), Slovak (79.8%, a difference of 0.0%), Korean (79.8%, a difference of 0.0%), Immigrants from South Eastern Asia (79.8%, a difference of 0.010%), and Pakistani (79.8%, a difference of 0.010%).
| Demographics | Rating | Rank | In Labor Force | Age 20-64 |
| Immigrants | Singapore | 86.7 /100 | #136 | Excellent 79.9% |
| Immigrants | Ukraine | 86.5 /100 | #137 | Excellent 79.9% |
| Immigrants | Nigeria | 86.4 /100 | #138 | Excellent 79.9% |
| Immigrants | Spain | 83.9 /100 | #139 | Excellent 79.8% |
| Immigrants | South Eastern Asia | 80.4 /100 | #140 | Excellent 79.8% |
| Immigrants | Israel | 80.0 /100 | #141 | Good 79.8% |
| Slovaks | 79.9 /100 | #142 | Good 79.8% |
| Immigrants | Sweden | 79.7 /100 | #143 | Good 79.8% |
| Koreans | 79.6 /100 | #144 | Good 79.8% |
| Pakistanis | 79.3 /100 | #145 | Good 79.8% |
| Immigrants | Southern Europe | 78.9 /100 | #146 | Good 79.8% |
| Immigrants | Philippines | 78.0 /100 | #147 | Good 79.8% |
| Romanians | 77.6 /100 | #148 | Good 79.8% |
| Icelanders | 75.1 /100 | #149 | Good 79.7% |
| Costa Ricans | 72.4 /100 | #150 | Good 79.7% |
Demographics Similar to Belizeans by In Labor Force | Age 20-64
In terms of in labor force | age 20-64, the demographic groups most similar to Belizeans are Immigrants from Dominica (78.1%, a difference of 0.040%), Mexican American Indian (78.2%, a difference of 0.050%), Immigrants from Bahamas (78.2%, a difference of 0.060%), Spanish (78.2%, a difference of 0.070%), and Puget Sound Salish (78.2%, a difference of 0.070%).
| Demographics | Rating | Rank | In Labor Force | Age 20-64 |
| Marshallese | 0.0 /100 | #272 | Tragic 78.3% |
| French American Indians | 0.0 /100 | #273 | Tragic 78.2% |
| Aleuts | 0.0 /100 | #274 | Tragic 78.2% |
| Spanish | 0.0 /100 | #275 | Tragic 78.2% |
| Puget Sound Salish | 0.0 /100 | #276 | Tragic 78.2% |
| Immigrants | Bahamas | 0.0 /100 | #277 | Tragic 78.2% |
| Mexican American Indians | 0.0 /100 | #278 | Tragic 78.2% |
| Belizeans | 0.0 /100 | #279 | Tragic 78.2% |
| Immigrants | Dominica | 0.0 /100 | #280 | Tragic 78.1% |
| Guyanese | 0.0 /100 | #281 | Tragic 78.1% |
| Immigrants | St. Vincent and the Grenadines | 0.0 /100 | #282 | Tragic 78.1% |
| Immigrants | Nonimmigrants | 0.0 /100 | #283 | Tragic 78.1% |
| Immigrants | Guyana | 0.0 /100 | #284 | Tragic 78.1% |
| Osage | 0.0 /100 | #285 | Tragic 78.0% |
| Immigrants | Belize | 0.0 /100 | #286 | Tragic 78.0% |