Immigrants from Sudan vs Assyrian/Chaldean/Syriac In Labor Force | Age 20-24
COMPARE
Immigrants from Sudan
Assyrian/Chaldean/Syriac
In Labor Force | Age 20-24
In Labor Force | Age 20-24 Comparison
Immigrants from Sudan
Assyrians/Chaldeans/Syriacs
76.8%
IN LABOR FORCE | AGE 20-24
99.8/ 100
METRIC RATING
69th/ 347
METRIC RANK
75.9%
IN LABOR FORCE | AGE 20-24
94.9/ 100
METRIC RATING
117th/ 347
METRIC RANK
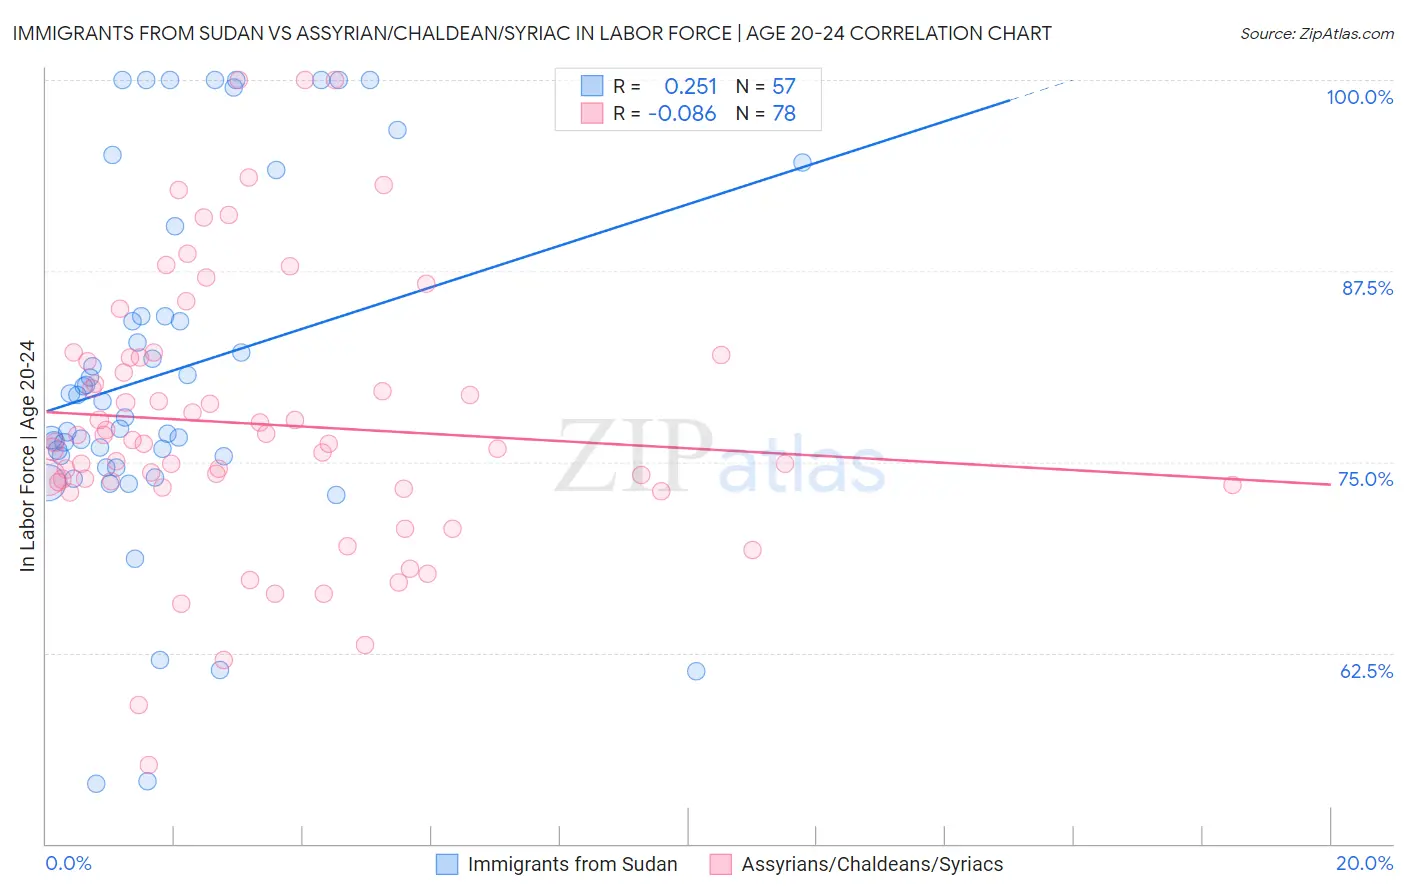
Immigrants from Sudan vs Assyrian/Chaldean/Syriac In Labor Force | Age 20-24 Correlation Chart
The statistical analysis conducted on geographies consisting of 118,956,424 people shows a weak positive correlation between the proportion of Immigrants from Sudan and labor force participation rate among population between the ages 20 and 24 in the United States with a correlation coefficient (R) of 0.251 and weighted average of 76.8%. Similarly, the statistical analysis conducted on geographies consisting of 110,301,769 people shows a slight negative correlation between the proportion of Assyrians/Chaldeans/Syriacs and labor force participation rate among population between the ages 20 and 24 in the United States with a correlation coefficient (R) of -0.086 and weighted average of 75.9%, a difference of 1.3%.
In Labor Force | Age 20-24 Correlation Summary
| Measurement | Immigrants from Sudan | Assyrian/Chaldean/Syriac |
| Minimum | 54.0% | 55.2% |
| Maximum | 100.0% | 100.0% |
| Range | 46.0% | 44.8% |
| Mean | 81.0% | 77.5% |
| Median | 78.9% | 76.3% |
| Interquartile 25% (IQ1) | 75.0% | 73.5% |
| Interquartile 75% (IQ3) | 87.5% | 81.9% |
| Interquartile Range (IQR) | 12.5% | 8.4% |
| Standard Deviation (Sample) | 11.7% | 8.8% |
| Standard Deviation (Population) | 11.6% | 8.7% |
Similar Demographics by In Labor Force | Age 20-24
Demographics Similar to Immigrants from Sudan by In Labor Force | Age 20-24
In terms of in labor force | age 20-24, the demographic groups most similar to Immigrants from Sudan are Ottawa (76.8%, a difference of 0.010%), French American Indian (76.8%, a difference of 0.020%), Slavic (76.9%, a difference of 0.050%), Icelander (76.9%, a difference of 0.060%), and Crow (76.9%, a difference of 0.080%).
| Demographics | Rating | Rank | In Labor Force | Age 20-24 |
| Immigrants | Kenya | 99.9 /100 | #62 | Exceptional 77.0% |
| Lithuanians | 99.9 /100 | #63 | Exceptional 77.0% |
| Whites/Caucasians | 99.9 /100 | #64 | Exceptional 76.9% |
| Crow | 99.9 /100 | #65 | Exceptional 76.9% |
| Icelanders | 99.9 /100 | #66 | Exceptional 76.9% |
| Slavs | 99.9 /100 | #67 | Exceptional 76.9% |
| French American Indians | 99.8 /100 | #68 | Exceptional 76.8% |
| Immigrants | Sudan | 99.8 /100 | #69 | Exceptional 76.8% |
| Ottawa | 99.8 /100 | #70 | Exceptional 76.8% |
| Northern Europeans | 99.8 /100 | #71 | Exceptional 76.8% |
| Guamanians/Chamorros | 99.8 /100 | #72 | Exceptional 76.7% |
| British | 99.8 /100 | #73 | Exceptional 76.7% |
| Cree | 99.7 /100 | #74 | Exceptional 76.6% |
| Immigrants | Middle Africa | 99.7 /100 | #75 | Exceptional 76.6% |
| Immigrants | Moldova | 99.6 /100 | #76 | Exceptional 76.6% |
Demographics Similar to Assyrians/Chaldeans/Syriacs by In Labor Force | Age 20-24
In terms of in labor force | age 20-24, the demographic groups most similar to Assyrians/Chaldeans/Syriacs are Alaska Native (75.9%, a difference of 0.010%), Immigrants from North America (75.9%, a difference of 0.010%), Spanish American (75.8%, a difference of 0.010%), Immigrants from Portugal (75.8%, a difference of 0.010%), and Immigrants from Zimbabwe (75.9%, a difference of 0.020%).
| Demographics | Rating | Rank | In Labor Force | Age 20-24 |
| Immigrants | Morocco | 95.8 /100 | #110 | Exceptional 75.9% |
| Ukrainians | 95.7 /100 | #111 | Exceptional 75.9% |
| Immigrants | Canada | 95.6 /100 | #112 | Exceptional 75.9% |
| Immigrants | Netherlands | 95.3 /100 | #113 | Exceptional 75.9% |
| Immigrants | Zimbabwe | 95.1 /100 | #114 | Exceptional 75.9% |
| Alaska Natives | 95.1 /100 | #115 | Exceptional 75.9% |
| Immigrants | North America | 95.0 /100 | #116 | Exceptional 75.9% |
| Assyrians/Chaldeans/Syriacs | 94.9 /100 | #117 | Exceptional 75.9% |
| Spanish Americans | 94.8 /100 | #118 | Exceptional 75.8% |
| Immigrants | Portugal | 94.8 /100 | #119 | Exceptional 75.8% |
| Immigrants | Africa | 94.6 /100 | #120 | Exceptional 75.8% |
| Immigrants | Serbia | 94.3 /100 | #121 | Exceptional 75.8% |
| Pakistanis | 94.1 /100 | #122 | Exceptional 75.8% |
| Immigrants | Bulgaria | 94.1 /100 | #123 | Exceptional 75.8% |
| Immigrants | Sierra Leone | 93.8 /100 | #124 | Exceptional 75.8% |