Immigrants from Sudan vs Immigrants from Kazakhstan In Labor Force | Age 25-29
COMPARE
Immigrants from Sudan
Immigrants from Kazakhstan
In Labor Force | Age 25-29
In Labor Force | Age 25-29 Comparison
Immigrants from Sudan
Immigrants from Kazakhstan
85.1%
IN LABOR FORCE | AGE 25-29
94.3/ 100
METRIC RATING
97th/ 347
METRIC RANK
84.4%
IN LABOR FORCE | AGE 25-29
17.5/ 100
METRIC RATING
200th/ 347
METRIC RANK
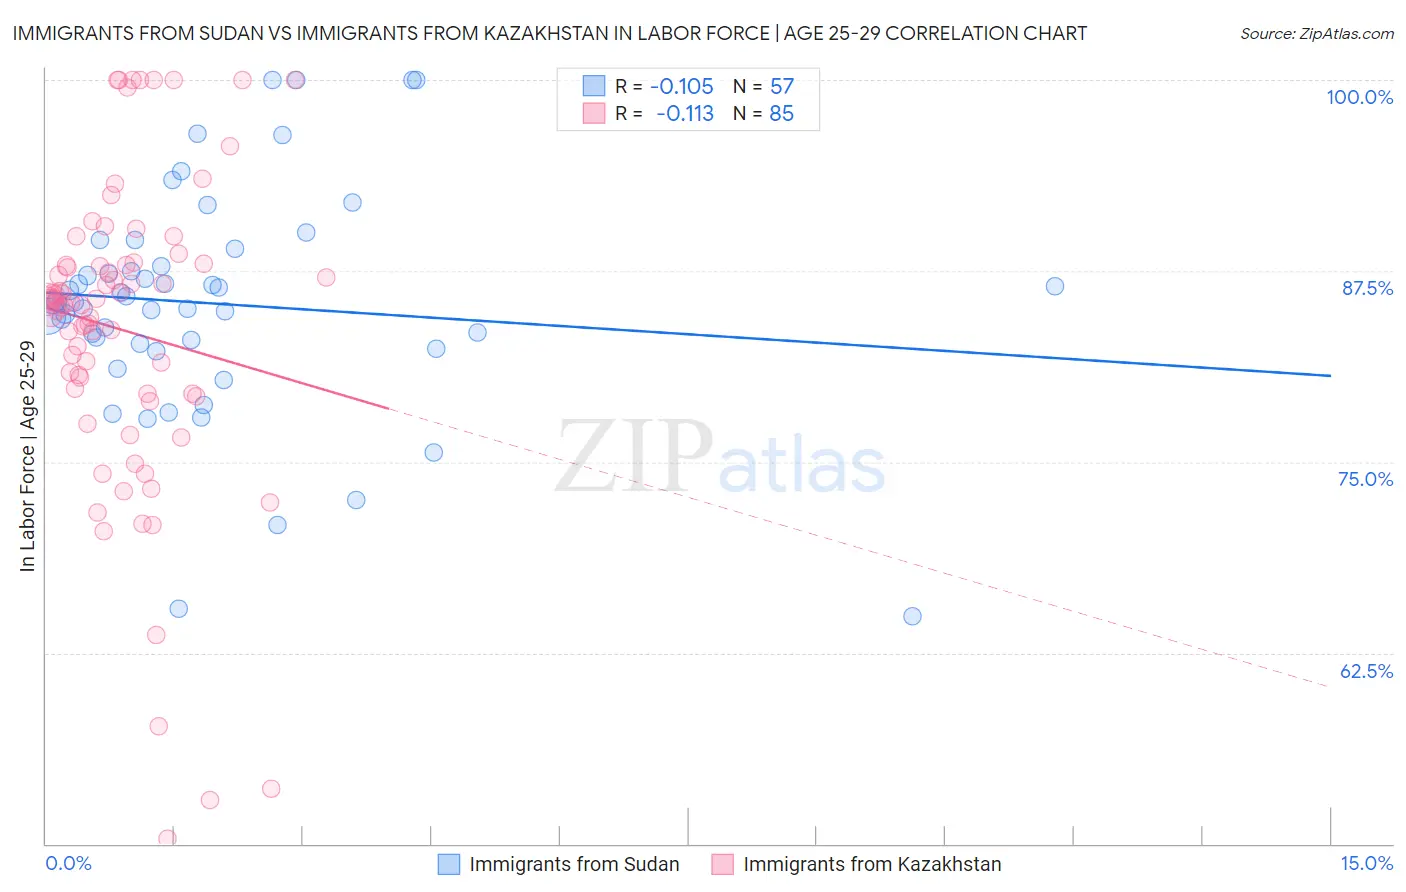
Immigrants from Sudan vs Immigrants from Kazakhstan In Labor Force | Age 25-29 Correlation Chart
The statistical analysis conducted on geographies consisting of 118,966,602 people shows a poor negative correlation between the proportion of Immigrants from Sudan and labor force participation rate among population between the ages 25 and 29 in the United States with a correlation coefficient (R) of -0.105 and weighted average of 85.1%. Similarly, the statistical analysis conducted on geographies consisting of 124,427,458 people shows a poor negative correlation between the proportion of Immigrants from Kazakhstan and labor force participation rate among population between the ages 25 and 29 in the United States with a correlation coefficient (R) of -0.113 and weighted average of 84.4%, a difference of 0.81%.
In Labor Force | Age 25-29 Correlation Summary
| Measurement | Immigrants from Sudan | Immigrants from Kazakhstan |
| Minimum | 64.9% | 50.3% |
| Maximum | 100.0% | 100.0% |
| Range | 35.1% | 49.7% |
| Mean | 85.4% | 83.6% |
| Median | 85.5% | 85.5% |
| Interquartile 25% (IQ1) | 82.6% | 79.5% |
| Interquartile 75% (IQ3) | 88.3% | 88.0% |
| Interquartile Range (IQR) | 5.8% | 8.5% |
| Standard Deviation (Sample) | 7.4% | 10.3% |
| Standard Deviation (Population) | 7.3% | 10.2% |
Similar Demographics by In Labor Force | Age 25-29
Demographics Similar to Immigrants from Sudan by In Labor Force | Age 25-29
In terms of in labor force | age 25-29, the demographic groups most similar to Immigrants from Sudan are Immigrants from Netherlands (85.1%, a difference of 0.010%), Immigrants from Romania (85.1%, a difference of 0.010%), Mongolian (85.1%, a difference of 0.010%), Bangladeshi (85.1%, a difference of 0.010%), and Immigrants from Switzerland (85.1%, a difference of 0.010%).
| Demographics | Rating | Rank | In Labor Force | Age 25-29 |
| Burmese | 95.9 /100 | #90 | Exceptional 85.1% |
| Immigrants | Moldova | 95.8 /100 | #91 | Exceptional 85.1% |
| Immigrants | Costa Rica | 95.5 /100 | #92 | Exceptional 85.1% |
| Austrians | 95.3 /100 | #93 | Exceptional 85.1% |
| Immigrants | Korea | 94.8 /100 | #94 | Exceptional 85.1% |
| Immigrants | Netherlands | 94.6 /100 | #95 | Exceptional 85.1% |
| Immigrants | Romania | 94.6 /100 | #96 | Exceptional 85.1% |
| Immigrants | Sudan | 94.3 /100 | #97 | Exceptional 85.1% |
| Mongolians | 94.1 /100 | #98 | Exceptional 85.1% |
| Bangladeshis | 94.0 /100 | #99 | Exceptional 85.1% |
| Immigrants | Switzerland | 93.9 /100 | #100 | Exceptional 85.1% |
| Egyptians | 93.8 /100 | #101 | Exceptional 85.1% |
| Slavs | 93.7 /100 | #102 | Exceptional 85.1% |
| Immigrants | Japan | 93.5 /100 | #103 | Exceptional 85.1% |
| Immigrants | Zaire | 93.3 /100 | #104 | Exceptional 85.1% |
Demographics Similar to Immigrants from Kazakhstan by In Labor Force | Age 25-29
In terms of in labor force | age 25-29, the demographic groups most similar to Immigrants from Kazakhstan are Immigrants from Germany (84.4%, a difference of 0.010%), Laotian (84.4%, a difference of 0.010%), Tlingit-Haida (84.4%, a difference of 0.020%), Immigrants from Iraq (84.4%, a difference of 0.020%), and Afghan (84.4%, a difference of 0.020%).
| Demographics | Rating | Rank | In Labor Force | Age 25-29 |
| South American Indians | 25.0 /100 | #193 | Fair 84.5% |
| Portuguese | 21.2 /100 | #194 | Fair 84.4% |
| Immigrants | Israel | 20.8 /100 | #195 | Fair 84.4% |
| Immigrants | South Eastern Asia | 19.5 /100 | #196 | Poor 84.4% |
| Tlingit-Haida | 19.3 /100 | #197 | Poor 84.4% |
| Immigrants | Iraq | 19.0 /100 | #198 | Poor 84.4% |
| Immigrants | Germany | 18.3 /100 | #199 | Poor 84.4% |
| Immigrants | Kazakhstan | 17.5 /100 | #200 | Poor 84.4% |
| Laotians | 16.6 /100 | #201 | Poor 84.4% |
| Afghans | 15.9 /100 | #202 | Poor 84.4% |
| Immigrants | Afghanistan | 15.6 /100 | #203 | Poor 84.4% |
| Venezuelans | 15.1 /100 | #204 | Poor 84.4% |
| Ecuadorians | 14.8 /100 | #205 | Poor 84.4% |
| Immigrants | Cambodia | 14.3 /100 | #206 | Poor 84.4% |
| Immigrants | Armenia | 13.3 /100 | #207 | Poor 84.4% |