Immigrants from Sudan vs Maltese In Labor Force | Age 20-24
COMPARE
Immigrants from Sudan
Maltese
In Labor Force | Age 20-24
In Labor Force | Age 20-24 Comparison
Immigrants from Sudan
Maltese
76.8%
IN LABOR FORCE | AGE 20-24
99.8/ 100
METRIC RATING
69th/ 347
METRIC RANK
76.3%
IN LABOR FORCE | AGE 20-24
98.9/ 100
METRIC RATING
92nd/ 347
METRIC RANK
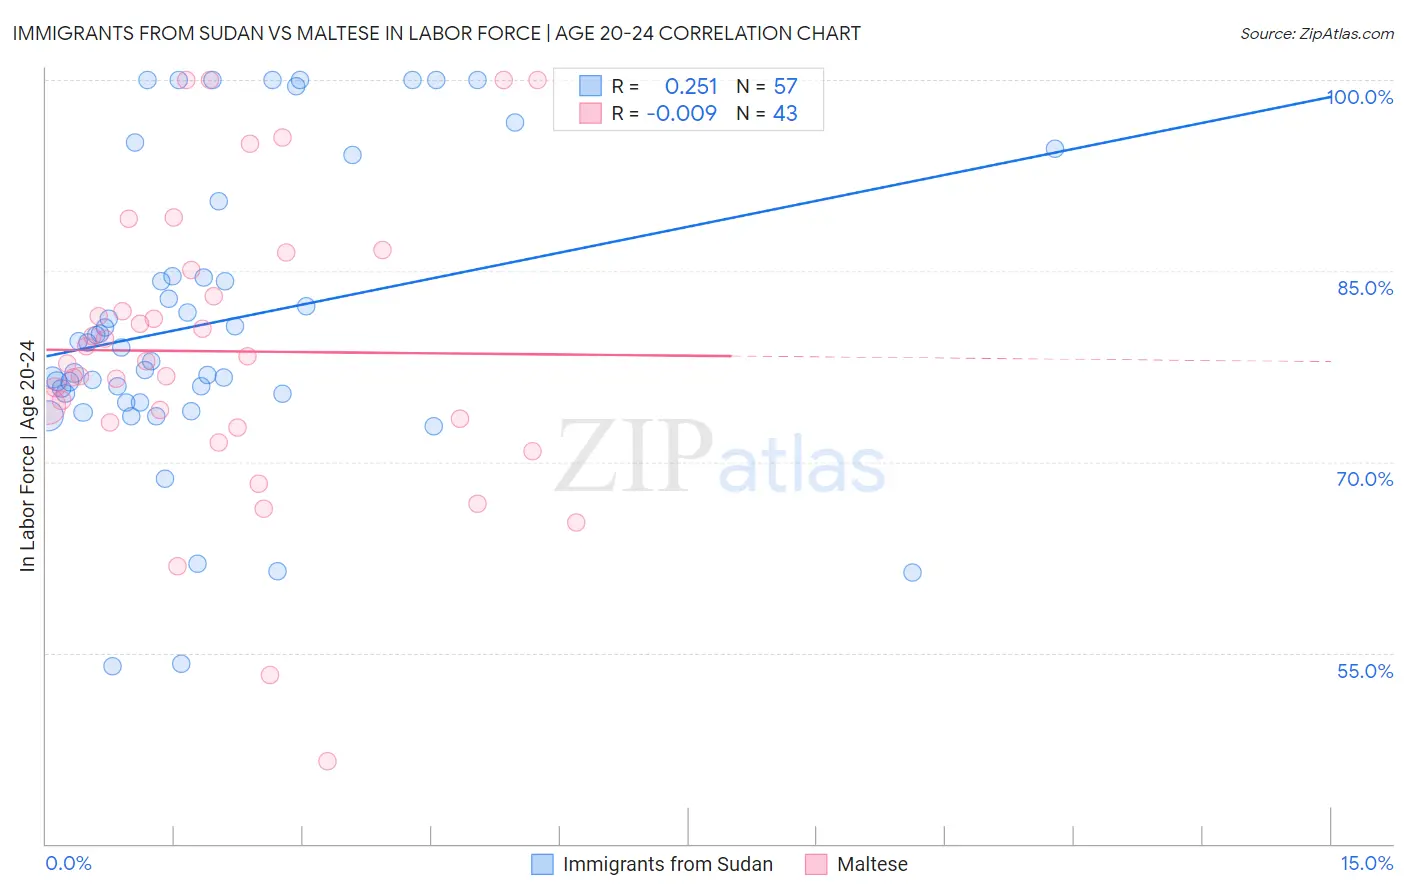
Immigrants from Sudan vs Maltese In Labor Force | Age 20-24 Correlation Chart
The statistical analysis conducted on geographies consisting of 118,956,424 people shows a weak positive correlation between the proportion of Immigrants from Sudan and labor force participation rate among population between the ages 20 and 24 in the United States with a correlation coefficient (R) of 0.251 and weighted average of 76.8%. Similarly, the statistical analysis conducted on geographies consisting of 126,433,922 people shows no correlation between the proportion of Maltese and labor force participation rate among population between the ages 20 and 24 in the United States with a correlation coefficient (R) of -0.009 and weighted average of 76.3%, a difference of 0.69%.
In Labor Force | Age 20-24 Correlation Summary
| Measurement | Immigrants from Sudan | Maltese |
| Minimum | 54.0% | 46.5% |
| Maximum | 100.0% | 100.0% |
| Range | 46.0% | 53.5% |
| Mean | 81.0% | 78.7% |
| Median | 78.9% | 77.9% |
| Interquartile 25% (IQ1) | 75.0% | 73.1% |
| Interquartile 75% (IQ3) | 87.5% | 85.1% |
| Interquartile Range (IQR) | 12.5% | 12.0% |
| Standard Deviation (Sample) | 11.7% | 11.6% |
| Standard Deviation (Population) | 11.6% | 11.5% |
Similar Demographics by In Labor Force | Age 20-24
Demographics Similar to Immigrants from Sudan by In Labor Force | Age 20-24
In terms of in labor force | age 20-24, the demographic groups most similar to Immigrants from Sudan are Ottawa (76.8%, a difference of 0.010%), French American Indian (76.8%, a difference of 0.020%), Slavic (76.9%, a difference of 0.050%), Icelander (76.9%, a difference of 0.060%), and Crow (76.9%, a difference of 0.080%).
| Demographics | Rating | Rank | In Labor Force | Age 20-24 |
| Immigrants | Kenya | 99.9 /100 | #62 | Exceptional 77.0% |
| Lithuanians | 99.9 /100 | #63 | Exceptional 77.0% |
| Whites/Caucasians | 99.9 /100 | #64 | Exceptional 76.9% |
| Crow | 99.9 /100 | #65 | Exceptional 76.9% |
| Icelanders | 99.9 /100 | #66 | Exceptional 76.9% |
| Slavs | 99.9 /100 | #67 | Exceptional 76.9% |
| French American Indians | 99.8 /100 | #68 | Exceptional 76.8% |
| Immigrants | Sudan | 99.8 /100 | #69 | Exceptional 76.8% |
| Ottawa | 99.8 /100 | #70 | Exceptional 76.8% |
| Northern Europeans | 99.8 /100 | #71 | Exceptional 76.8% |
| Guamanians/Chamorros | 99.8 /100 | #72 | Exceptional 76.7% |
| British | 99.8 /100 | #73 | Exceptional 76.7% |
| Cree | 99.7 /100 | #74 | Exceptional 76.6% |
| Immigrants | Middle Africa | 99.7 /100 | #75 | Exceptional 76.6% |
| Immigrants | Moldova | 99.6 /100 | #76 | Exceptional 76.6% |
Demographics Similar to Maltese by In Labor Force | Age 20-24
In terms of in labor force | age 20-24, the demographic groups most similar to Maltese are Hungarian (76.3%, a difference of 0.020%), Sierra Leonean (76.3%, a difference of 0.030%), Immigrants from Burma/Myanmar (76.3%, a difference of 0.050%), Spanish (76.4%, a difference of 0.10%), and Bulgarian (76.4%, a difference of 0.10%).
| Demographics | Rating | Rank | In Labor Force | Age 20-24 |
| Portuguese | 99.3 /100 | #85 | Exceptional 76.4% |
| Immigrants | Iraq | 99.3 /100 | #86 | Exceptional 76.4% |
| Immigrants | Thailand | 99.3 /100 | #87 | Exceptional 76.4% |
| Spanish | 99.2 /100 | #88 | Exceptional 76.4% |
| Bulgarians | 99.2 /100 | #89 | Exceptional 76.4% |
| Immigrants | Burma/Myanmar | 99.1 /100 | #90 | Exceptional 76.3% |
| Sierra Leoneans | 99.0 /100 | #91 | Exceptional 76.3% |
| Maltese | 98.9 /100 | #92 | Exceptional 76.3% |
| Hungarians | 98.9 /100 | #93 | Exceptional 76.3% |
| Potawatomi | 98.5 /100 | #94 | Exceptional 76.2% |
| Immigrants | Germany | 98.5 /100 | #95 | Exceptional 76.2% |
| Immigrants | Nonimmigrants | 98.5 /100 | #96 | Exceptional 76.2% |
| Immigrants | Lithuania | 98.0 /100 | #97 | Exceptional 76.1% |
| Immigrants | Oceania | 98.0 /100 | #98 | Exceptional 76.1% |
| Americans | 97.8 /100 | #99 | Exceptional 76.1% |