Immigrants from Spain vs Immigrants from Jordan In Labor Force | Age 20-24
COMPARE
Immigrants from Spain
Immigrants from Jordan
In Labor Force | Age 20-24
In Labor Force | Age 20-24 Comparison
Immigrants from Spain
Immigrants from Jordan
73.2%
IN LABOR FORCE | AGE 20-24
0.1/ 100
METRIC RATING
282nd/ 347
METRIC RANK
75.6%
IN LABOR FORCE | AGE 20-24
88.5/ 100
METRIC RATING
131st/ 347
METRIC RANK
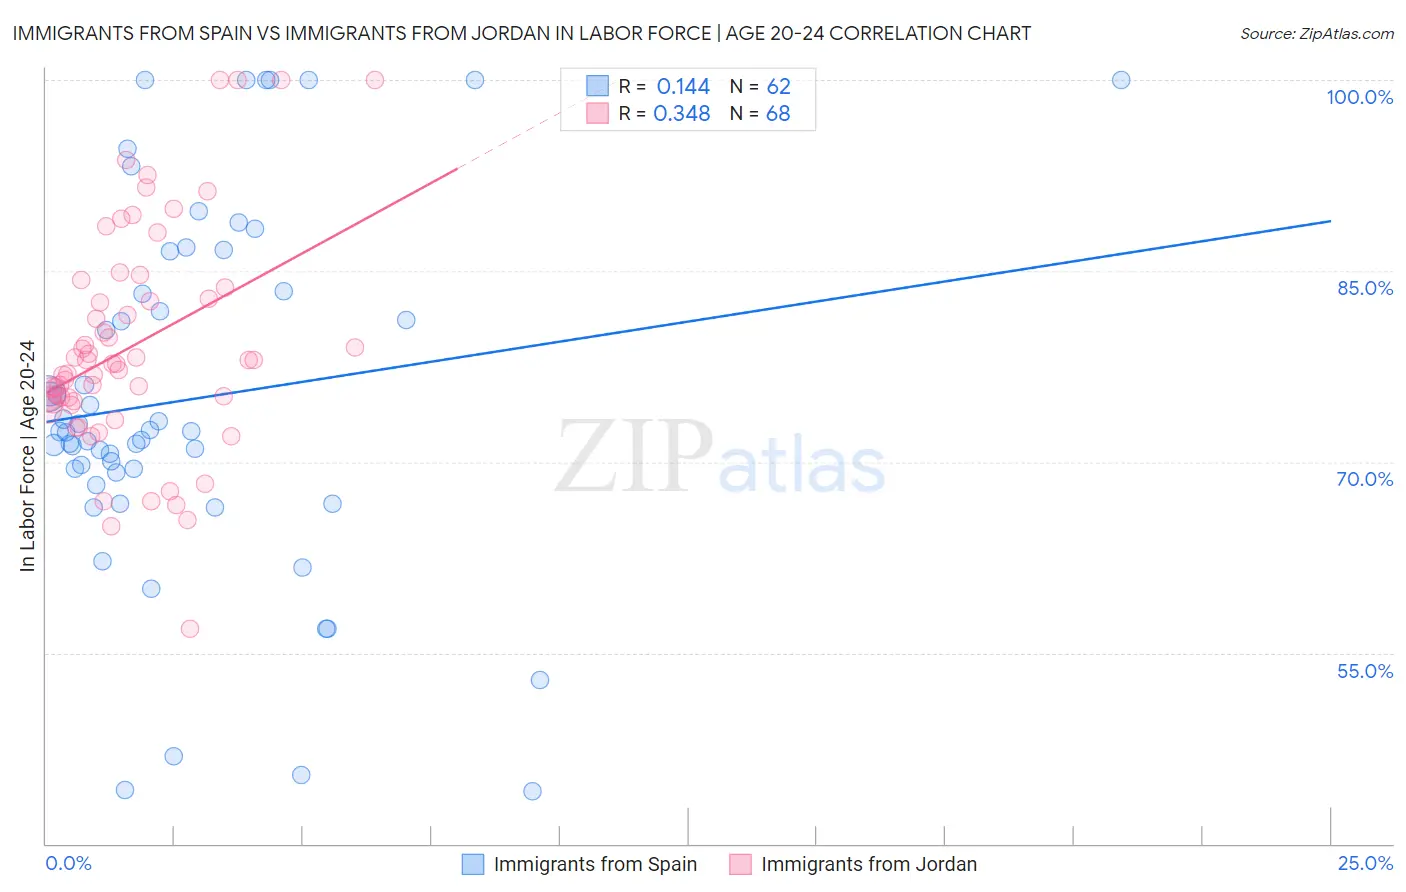
Immigrants from Spain vs Immigrants from Jordan In Labor Force | Age 20-24 Correlation Chart
The statistical analysis conducted on geographies consisting of 239,648,988 people shows a poor positive correlation between the proportion of Immigrants from Spain and labor force participation rate among population between the ages 20 and 24 in the United States with a correlation coefficient (R) of 0.144 and weighted average of 73.2%. Similarly, the statistical analysis conducted on geographies consisting of 181,268,030 people shows a mild positive correlation between the proportion of Immigrants from Jordan and labor force participation rate among population between the ages 20 and 24 in the United States with a correlation coefficient (R) of 0.348 and weighted average of 75.6%, a difference of 3.3%.
In Labor Force | Age 20-24 Correlation Summary
| Measurement | Immigrants from Spain | Immigrants from Jordan |
| Minimum | 44.1% | 56.9% |
| Maximum | 100.0% | 100.0% |
| Range | 55.9% | 43.1% |
| Mean | 74.9% | 79.1% |
| Median | 72.4% | 77.7% |
| Interquartile 25% (IQ1) | 69.2% | 74.7% |
| Interquartile 75% (IQ3) | 83.4% | 83.3% |
| Interquartile Range (IQR) | 14.2% | 8.6% |
| Standard Deviation (Sample) | 14.2% | 8.8% |
| Standard Deviation (Population) | 14.1% | 8.7% |
Similar Demographics by In Labor Force | Age 20-24
Demographics Similar to Immigrants from Spain by In Labor Force | Age 20-24
In terms of in labor force | age 20-24, the demographic groups most similar to Immigrants from Spain are Immigrants from Venezuela (73.2%, a difference of 0.010%), Immigrants from Bahamas (73.2%, a difference of 0.010%), Kiowa (73.2%, a difference of 0.030%), Bahamian (73.3%, a difference of 0.040%), and Nicaraguan (73.2%, a difference of 0.090%).
| Demographics | Rating | Rank | In Labor Force | Age 20-24 |
| Immigrants | South America | 0.2 /100 | #275 | Tragic 73.3% |
| Mongolians | 0.2 /100 | #276 | Tragic 73.3% |
| Immigrants | Malaysia | 0.2 /100 | #277 | Tragic 73.3% |
| Cypriots | 0.2 /100 | #278 | Tragic 73.3% |
| Venezuelans | 0.2 /100 | #279 | Tragic 73.3% |
| Bahamians | 0.1 /100 | #280 | Tragic 73.3% |
| Immigrants | Venezuela | 0.1 /100 | #281 | Tragic 73.2% |
| Immigrants | Spain | 0.1 /100 | #282 | Tragic 73.2% |
| Immigrants | Bahamas | 0.1 /100 | #283 | Tragic 73.2% |
| Kiowa | 0.1 /100 | #284 | Tragic 73.2% |
| Nicaraguans | 0.1 /100 | #285 | Tragic 73.2% |
| Immigrants | Lebanon | 0.1 /100 | #286 | Tragic 73.1% |
| Immigrants | Korea | 0.1 /100 | #287 | Tragic 73.1% |
| Argentineans | 0.1 /100 | #288 | Tragic 73.1% |
| U.S. Virgin Islanders | 0.1 /100 | #289 | Tragic 73.0% |
Demographics Similar to Immigrants from Jordan by In Labor Force | Age 20-24
In terms of in labor force | age 20-24, the demographic groups most similar to Immigrants from Jordan are Palestinian (75.6%, a difference of 0.0%), Immigrants from Austria (75.6%, a difference of 0.010%), Zimbabwean (75.6%, a difference of 0.010%), Iroquois (75.6%, a difference of 0.020%), and Immigrants from Afghanistan (75.6%, a difference of 0.030%).
| Demographics | Rating | Rank | In Labor Force | Age 20-24 |
| Immigrants | Sierra Leone | 93.8 /100 | #124 | Exceptional 75.8% |
| Immigrants | Scotland | 93.7 /100 | #125 | Exceptional 75.8% |
| Brazilians | 93.0 /100 | #126 | Exceptional 75.8% |
| Sub-Saharan Africans | 90.9 /100 | #127 | Exceptional 75.7% |
| Immigrants | Afghanistan | 89.4 /100 | #128 | Excellent 75.6% |
| Iroquois | 89.1 /100 | #129 | Excellent 75.6% |
| Immigrants | Austria | 88.8 /100 | #130 | Excellent 75.6% |
| Immigrants | Jordan | 88.5 /100 | #131 | Excellent 75.6% |
| Palestinians | 88.4 /100 | #132 | Excellent 75.6% |
| Zimbabweans | 88.2 /100 | #133 | Excellent 75.6% |
| Estonians | 87.1 /100 | #134 | Excellent 75.6% |
| Yaqui | 85.5 /100 | #135 | Excellent 75.5% |
| Immigrants | Brazil | 84.8 /100 | #136 | Excellent 75.5% |
| Jordanians | 84.8 /100 | #137 | Excellent 75.5% |
| Australians | 84.8 /100 | #138 | Excellent 75.5% |