Immigrants from South America vs Hawaiian Doctorate Degree
COMPARE
Immigrants from South America
Hawaiian
Doctorate Degree
Doctorate Degree Comparison
Immigrants from South America
Hawaiians
1.8%
DOCTORATE DEGREE
23.3/ 100
METRIC RATING
199th/ 347
METRIC RANK
1.5%
DOCTORATE DEGREE
0.4/ 100
METRIC RATING
278th/ 347
METRIC RANK
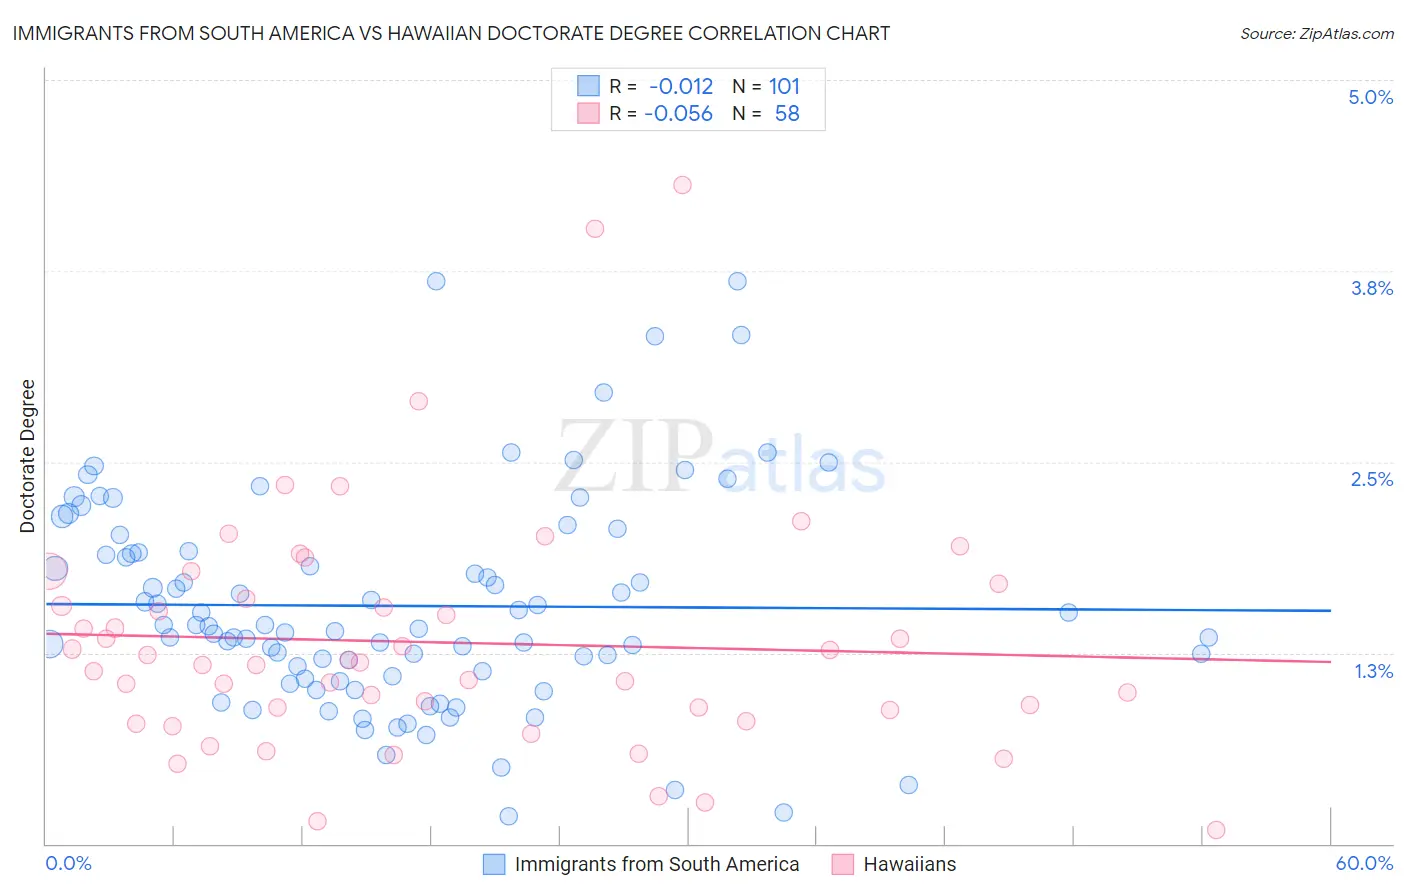
Immigrants from South America vs Hawaiian Doctorate Degree Correlation Chart
The statistical analysis conducted on geographies consisting of 479,287,152 people shows no correlation between the proportion of Immigrants from South America and percentage of population with at least doctorate degree education in the United States with a correlation coefficient (R) of -0.012 and weighted average of 1.8%. Similarly, the statistical analysis conducted on geographies consisting of 323,773,151 people shows a slight negative correlation between the proportion of Hawaiians and percentage of population with at least doctorate degree education in the United States with a correlation coefficient (R) of -0.056 and weighted average of 1.5%, a difference of 20.2%.
Doctorate Degree Correlation Summary
| Measurement | Immigrants from South America | Hawaiian |
| Minimum | 0.18% | 0.092% |
| Maximum | 3.7% | 4.3% |
| Range | 3.5% | 4.2% |
| Mean | 1.6% | 1.3% |
| Median | 1.4% | 1.2% |
| Interquartile 25% (IQ1) | 1.1% | 0.88% |
| Interquartile 75% (IQ3) | 1.9% | 1.6% |
| Interquartile Range (IQR) | 0.82% | 0.73% |
| Standard Deviation (Sample) | 0.70% | 0.79% |
| Standard Deviation (Population) | 0.70% | 0.78% |
Similar Demographics by Doctorate Degree
Demographics Similar to Immigrants from South America by Doctorate Degree
In terms of doctorate degree, the demographic groups most similar to Immigrants from South America are White/Caucasian (1.8%, a difference of 0.11%), Immigrants from Nigeria (1.8%, a difference of 0.18%), Immigrants from Ghana (1.8%, a difference of 0.29%), Chinese (1.8%, a difference of 0.37%), and Subsaharan African (1.8%, a difference of 0.38%).
| Demographics | Rating | Rank | Doctorate Degree |
| Dutch | 27.4 /100 | #192 | Fair 1.8% |
| German Russians | 27.1 /100 | #193 | Fair 1.8% |
| Uruguayans | 26.2 /100 | #194 | Fair 1.8% |
| Immigrants | Somalia | 25.4 /100 | #195 | Fair 1.8% |
| Sub-Saharan Africans | 25.1 /100 | #196 | Fair 1.8% |
| Chinese | 25.1 /100 | #197 | Fair 1.8% |
| Immigrants | Ghana | 24.6 /100 | #198 | Fair 1.8% |
| Immigrants | South America | 23.3 /100 | #199 | Fair 1.8% |
| Whites/Caucasians | 22.8 /100 | #200 | Fair 1.8% |
| Immigrants | Nigeria | 22.4 /100 | #201 | Fair 1.8% |
| Portuguese | 21.4 /100 | #202 | Fair 1.8% |
| Immigrants | Vietnam | 21.4 /100 | #203 | Fair 1.8% |
| Somalis | 21.2 /100 | #204 | Fair 1.7% |
| Venezuelans | 19.5 /100 | #205 | Poor 1.7% |
| Immigrants | Peru | 17.6 /100 | #206 | Poor 1.7% |
Demographics Similar to Hawaiians by Doctorate Degree
In terms of doctorate degree, the demographic groups most similar to Hawaiians are Bahamian (1.5%, a difference of 0.060%), Marshallese (1.5%, a difference of 0.22%), Ecuadorian (1.5%, a difference of 0.23%), Tohono O'odham (1.5%, a difference of 0.30%), and British West Indian (1.5%, a difference of 0.35%).
| Demographics | Rating | Rank | Doctorate Degree |
| Immigrants | Trinidad and Tobago | 0.5 /100 | #271 | Tragic 1.5% |
| Immigrants | Barbados | 0.4 /100 | #272 | Tragic 1.5% |
| Sioux | 0.4 /100 | #273 | Tragic 1.5% |
| Yaqui | 0.4 /100 | #274 | Tragic 1.5% |
| Aleuts | 0.4 /100 | #275 | Tragic 1.5% |
| Paiute | 0.4 /100 | #276 | Tragic 1.5% |
| Bahamians | 0.4 /100 | #277 | Tragic 1.5% |
| Hawaiians | 0.4 /100 | #278 | Tragic 1.5% |
| Marshallese | 0.4 /100 | #279 | Tragic 1.5% |
| Ecuadorians | 0.4 /100 | #280 | Tragic 1.5% |
| Tohono O'odham | 0.4 /100 | #281 | Tragic 1.5% |
| British West Indians | 0.3 /100 | #282 | Tragic 1.5% |
| Central Americans | 0.3 /100 | #283 | Tragic 1.5% |
| Jamaicans | 0.3 /100 | #284 | Tragic 1.5% |
| Malaysians | 0.3 /100 | #285 | Tragic 1.5% |