Immigrants from Somalia vs Latvian In Labor Force | Age 20-64
COMPARE
Immigrants from Somalia
Latvian
In Labor Force | Age 20-64
In Labor Force | Age 20-64 Comparison
Immigrants from Somalia
Latvians
81.6%
IN LABOR FORCE | AGE 20-64
100.0/ 100
METRIC RATING
8th/ 347
METRIC RANK
80.5%
IN LABOR FORCE | AGE 20-64
99.8/ 100
METRIC RATING
42nd/ 347
METRIC RANK
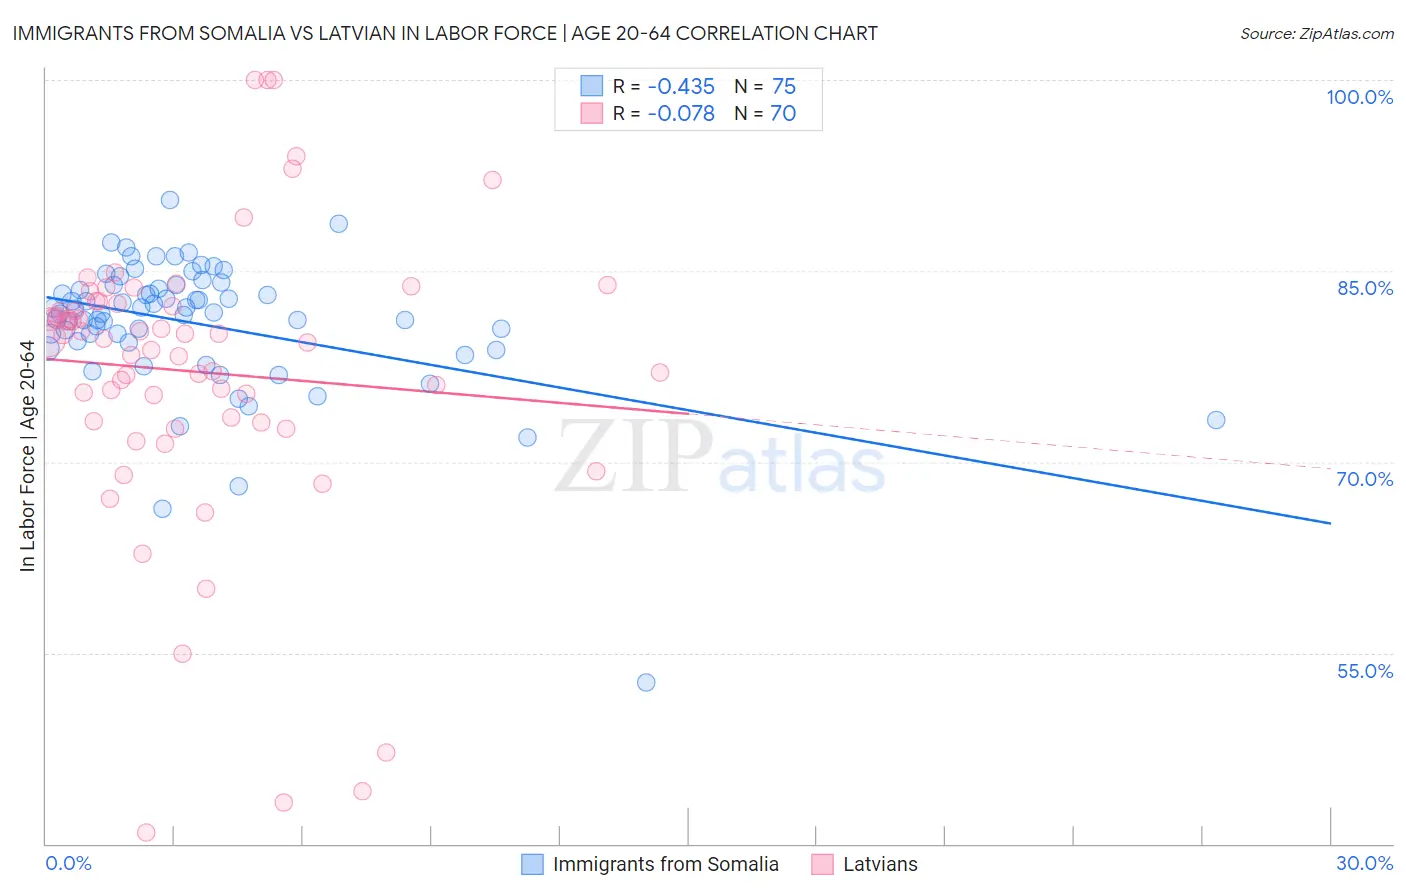
Immigrants from Somalia vs Latvian In Labor Force | Age 20-64 Correlation Chart
The statistical analysis conducted on geographies consisting of 92,107,842 people shows a moderate negative correlation between the proportion of Immigrants from Somalia and labor force participation rate among population between the ages 20 and 64 in the United States with a correlation coefficient (R) of -0.435 and weighted average of 81.6%. Similarly, the statistical analysis conducted on geographies consisting of 220,728,272 people shows a slight negative correlation between the proportion of Latvians and labor force participation rate among population between the ages 20 and 64 in the United States with a correlation coefficient (R) of -0.078 and weighted average of 80.5%, a difference of 1.3%.
In Labor Force | Age 20-64 Correlation Summary
| Measurement | Immigrants from Somalia | Latvian |
| Minimum | 52.7% | 40.9% |
| Maximum | 90.6% | 100.0% |
| Range | 37.9% | 59.1% |
| Mean | 80.8% | 77.1% |
| Median | 81.7% | 79.7% |
| Interquartile 25% (IQ1) | 79.4% | 73.2% |
| Interquartile 75% (IQ3) | 83.9% | 82.4% |
| Interquartile Range (IQR) | 4.4% | 9.2% |
| Standard Deviation (Sample) | 5.4% | 11.6% |
| Standard Deviation (Population) | 5.4% | 11.5% |
Similar Demographics by In Labor Force | Age 20-64
Demographics Similar to Immigrants from Somalia by In Labor Force | Age 20-64
In terms of in labor force | age 20-64, the demographic groups most similar to Immigrants from Somalia are Sierra Leonean (81.5%, a difference of 0.0%), Immigrants from Cameroon (81.6%, a difference of 0.020%), Somali (81.6%, a difference of 0.060%), Immigrants from Sierra Leone (81.5%, a difference of 0.12%), and Bolivian (81.7%, a difference of 0.17%).
| Demographics | Rating | Rank | In Labor Force | Age 20-64 |
| Immigrants | Ethiopia | 100.0 /100 | #1 | Exceptional 82.1% |
| Ethiopians | 100.0 /100 | #2 | Exceptional 82.0% |
| Immigrants | Bolivia | 100.0 /100 | #3 | Exceptional 81.9% |
| Luxembourgers | 100.0 /100 | #4 | Exceptional 81.9% |
| Bolivians | 100.0 /100 | #5 | Exceptional 81.7% |
| Somalis | 100.0 /100 | #6 | Exceptional 81.6% |
| Immigrants | Cameroon | 100.0 /100 | #7 | Exceptional 81.6% |
| Immigrants | Somalia | 100.0 /100 | #8 | Exceptional 81.6% |
| Sierra Leoneans | 100.0 /100 | #9 | Exceptional 81.5% |
| Immigrants | Sierra Leone | 100.0 /100 | #10 | Exceptional 81.5% |
| Immigrants | Eastern Africa | 100.0 /100 | #11 | Exceptional 81.3% |
| Immigrants | Eritrea | 100.0 /100 | #12 | Exceptional 81.3% |
| Immigrants | India | 100.0 /100 | #13 | Exceptional 81.3% |
| Cambodians | 100.0 /100 | #14 | Exceptional 81.1% |
| Bulgarians | 100.0 /100 | #15 | Exceptional 81.1% |
Demographics Similar to Latvians by In Labor Force | Age 20-64
In terms of in labor force | age 20-64, the demographic groups most similar to Latvians are Czech (80.5%, a difference of 0.010%), Immigrants from Liberia (80.5%, a difference of 0.020%), Brazilian (80.5%, a difference of 0.030%), Immigrants from Zimbabwe (80.5%, a difference of 0.030%), and Ugandan (80.6%, a difference of 0.040%).
| Demographics | Rating | Rank | In Labor Force | Age 20-64 |
| Immigrants | Poland | 99.9 /100 | #35 | Exceptional 80.6% |
| Paraguayans | 99.8 /100 | #36 | Exceptional 80.6% |
| Immigrants | Moldova | 99.8 /100 | #37 | Exceptional 80.6% |
| Ugandans | 99.8 /100 | #38 | Exceptional 80.6% |
| Brazilians | 99.8 /100 | #39 | Exceptional 80.5% |
| Immigrants | Zimbabwe | 99.8 /100 | #40 | Exceptional 80.5% |
| Immigrants | Liberia | 99.8 /100 | #41 | Exceptional 80.5% |
| Latvians | 99.8 /100 | #42 | Exceptional 80.5% |
| Czechs | 99.7 /100 | #43 | Exceptional 80.5% |
| Immigrants | Middle Africa | 99.7 /100 | #44 | Exceptional 80.5% |
| Slovenes | 99.7 /100 | #45 | Exceptional 80.5% |
| Immigrants | Pakistan | 99.6 /100 | #46 | Exceptional 80.5% |
| Immigrants | Africa | 99.6 /100 | #47 | Exceptional 80.4% |
| Immigrants | Hong Kong | 99.5 /100 | #48 | Exceptional 80.4% |
| Immigrants | Greece | 99.4 /100 | #49 | Exceptional 80.4% |