Immigrants from Somalia vs Argentinean In Labor Force | Age 20-64
COMPARE
Immigrants from Somalia
Argentinean
In Labor Force | Age 20-64
In Labor Force | Age 20-64 Comparison
Immigrants from Somalia
Argentineans
81.6%
IN LABOR FORCE | AGE 20-64
100.0/ 100
METRIC RATING
8th/ 347
METRIC RANK
80.0%
IN LABOR FORCE | AGE 20-64
93.8/ 100
METRIC RATING
114th/ 347
METRIC RANK
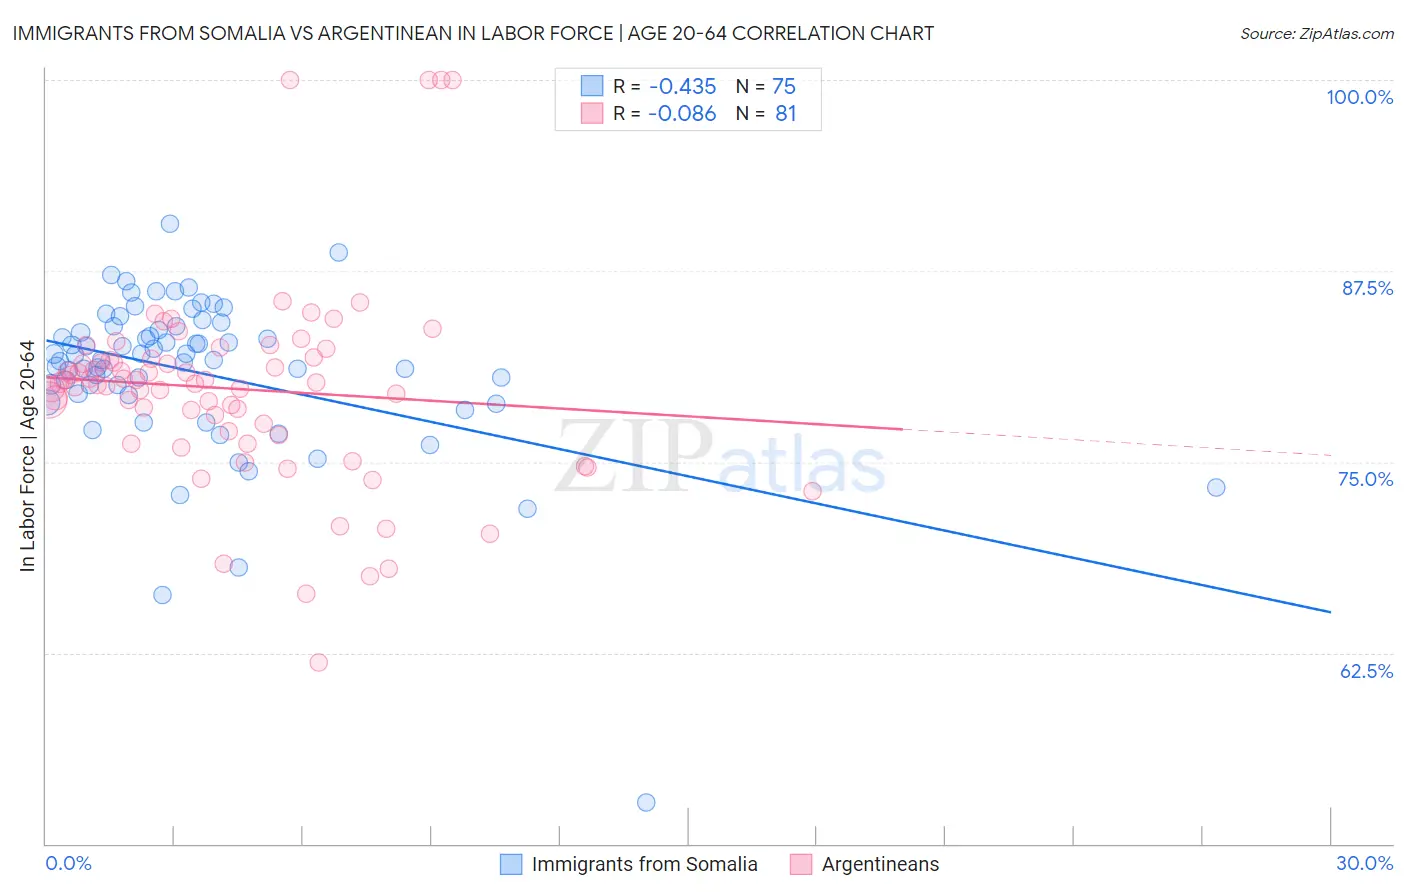
Immigrants from Somalia vs Argentinean In Labor Force | Age 20-64 Correlation Chart
The statistical analysis conducted on geographies consisting of 92,107,842 people shows a moderate negative correlation between the proportion of Immigrants from Somalia and labor force participation rate among population between the ages 20 and 64 in the United States with a correlation coefficient (R) of -0.435 and weighted average of 81.6%. Similarly, the statistical analysis conducted on geographies consisting of 297,148,532 people shows a slight negative correlation between the proportion of Argentineans and labor force participation rate among population between the ages 20 and 64 in the United States with a correlation coefficient (R) of -0.086 and weighted average of 80.0%, a difference of 1.9%.
In Labor Force | Age 20-64 Correlation Summary
| Measurement | Immigrants from Somalia | Argentinean |
| Minimum | 52.7% | 61.9% |
| Maximum | 90.6% | 100.0% |
| Range | 37.9% | 38.1% |
| Mean | 80.8% | 79.8% |
| Median | 81.7% | 80.2% |
| Interquartile 25% (IQ1) | 79.4% | 76.9% |
| Interquartile 75% (IQ3) | 83.9% | 81.8% |
| Interquartile Range (IQR) | 4.4% | 4.9% |
| Standard Deviation (Sample) | 5.4% | 6.5% |
| Standard Deviation (Population) | 5.4% | 6.5% |
Similar Demographics by In Labor Force | Age 20-64
Demographics Similar to Immigrants from Somalia by In Labor Force | Age 20-64
In terms of in labor force | age 20-64, the demographic groups most similar to Immigrants from Somalia are Sierra Leonean (81.5%, a difference of 0.0%), Immigrants from Cameroon (81.6%, a difference of 0.020%), Somali (81.6%, a difference of 0.060%), Immigrants from Sierra Leone (81.5%, a difference of 0.12%), and Bolivian (81.7%, a difference of 0.17%).
| Demographics | Rating | Rank | In Labor Force | Age 20-64 |
| Immigrants | Ethiopia | 100.0 /100 | #1 | Exceptional 82.1% |
| Ethiopians | 100.0 /100 | #2 | Exceptional 82.0% |
| Immigrants | Bolivia | 100.0 /100 | #3 | Exceptional 81.9% |
| Luxembourgers | 100.0 /100 | #4 | Exceptional 81.9% |
| Bolivians | 100.0 /100 | #5 | Exceptional 81.7% |
| Somalis | 100.0 /100 | #6 | Exceptional 81.6% |
| Immigrants | Cameroon | 100.0 /100 | #7 | Exceptional 81.6% |
| Immigrants | Somalia | 100.0 /100 | #8 | Exceptional 81.6% |
| Sierra Leoneans | 100.0 /100 | #9 | Exceptional 81.5% |
| Immigrants | Sierra Leone | 100.0 /100 | #10 | Exceptional 81.5% |
| Immigrants | Eastern Africa | 100.0 /100 | #11 | Exceptional 81.3% |
| Immigrants | Eritrea | 100.0 /100 | #12 | Exceptional 81.3% |
| Immigrants | India | 100.0 /100 | #13 | Exceptional 81.3% |
| Cambodians | 100.0 /100 | #14 | Exceptional 81.1% |
| Bulgarians | 100.0 /100 | #15 | Exceptional 81.1% |
Demographics Similar to Argentineans by In Labor Force | Age 20-64
In terms of in labor force | age 20-64, the demographic groups most similar to Argentineans are Immigrants from Italy (80.0%, a difference of 0.0%), Sri Lankan (80.0%, a difference of 0.0%), Immigrants from Argentina (80.0%, a difference of 0.010%), Estonian (80.0%, a difference of 0.010%), and Immigrants from South America (80.0%, a difference of 0.010%).
| Demographics | Rating | Rank | In Labor Force | Age 20-64 |
| Immigrants | Jordan | 94.8 /100 | #107 | Exceptional 80.0% |
| Iranians | 94.3 /100 | #108 | Exceptional 80.0% |
| Immigrants | Argentina | 94.1 /100 | #109 | Exceptional 80.0% |
| Estonians | 94.0 /100 | #110 | Exceptional 80.0% |
| Immigrants | South America | 93.9 /100 | #111 | Exceptional 80.0% |
| Immigrants | Italy | 93.9 /100 | #112 | Exceptional 80.0% |
| Sri Lankans | 93.9 /100 | #113 | Exceptional 80.0% |
| Argentineans | 93.8 /100 | #114 | Exceptional 80.0% |
| Bermudans | 93.3 /100 | #115 | Exceptional 80.0% |
| Immigrants | Western Africa | 93.1 /100 | #116 | Exceptional 80.0% |
| Immigrants | Vietnam | 92.7 /100 | #117 | Exceptional 80.0% |
| Cape Verdeans | 92.7 /100 | #118 | Exceptional 80.0% |
| Immigrants | Taiwan | 92.5 /100 | #119 | Exceptional 80.0% |
| Maltese | 92.4 /100 | #120 | Exceptional 80.0% |
| Immigrants | Kuwait | 92.2 /100 | #121 | Exceptional 80.0% |