Alsatian vs Latvian In Labor Force | Age 20-64
COMPARE
Alsatian
Latvian
In Labor Force | Age 20-64
In Labor Force | Age 20-64 Comparison
Alsatians
Latvians
79.1%
IN LABOR FORCE | AGE 20-64
5.7/ 100
METRIC RATING
229th/ 347
METRIC RANK
80.5%
IN LABOR FORCE | AGE 20-64
99.8/ 100
METRIC RATING
42nd/ 347
METRIC RANK
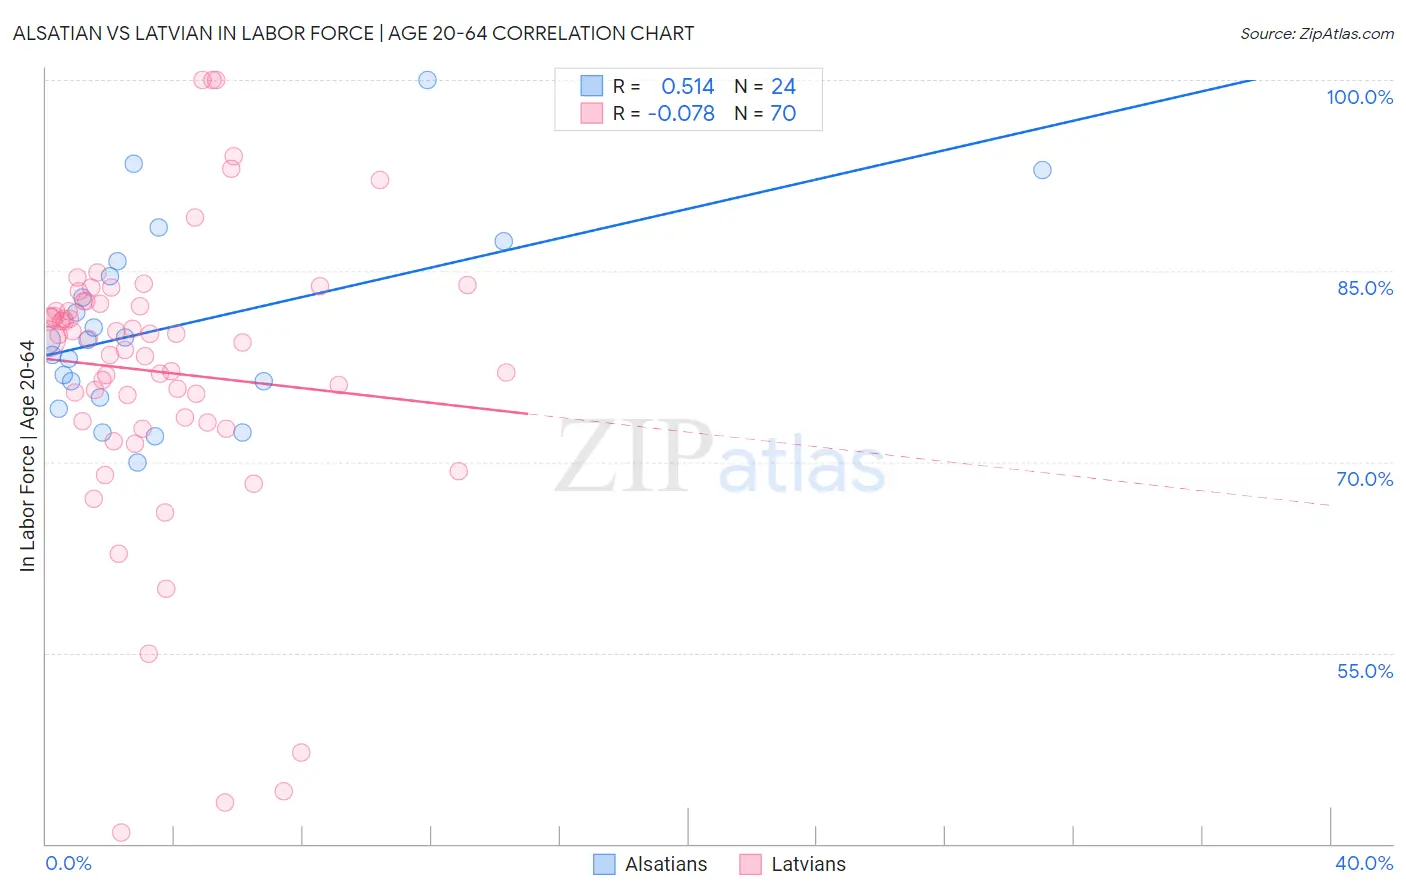
Alsatian vs Latvian In Labor Force | Age 20-64 Correlation Chart
The statistical analysis conducted on geographies consisting of 82,681,658 people shows a substantial positive correlation between the proportion of Alsatians and labor force participation rate among population between the ages 20 and 64 in the United States with a correlation coefficient (R) of 0.514 and weighted average of 79.1%. Similarly, the statistical analysis conducted on geographies consisting of 220,728,272 people shows a slight negative correlation between the proportion of Latvians and labor force participation rate among population between the ages 20 and 64 in the United States with a correlation coefficient (R) of -0.078 and weighted average of 80.5%, a difference of 1.8%.
In Labor Force | Age 20-64 Correlation Summary
| Measurement | Alsatian | Latvian |
| Minimum | 70.0% | 40.9% |
| Maximum | 100.0% | 100.0% |
| Range | 30.0% | 59.1% |
| Mean | 80.8% | 77.1% |
| Median | 79.6% | 79.7% |
| Interquartile 25% (IQ1) | 75.7% | 73.2% |
| Interquartile 75% (IQ3) | 85.2% | 82.4% |
| Interquartile Range (IQR) | 9.5% | 9.2% |
| Standard Deviation (Sample) | 7.5% | 11.6% |
| Standard Deviation (Population) | 7.4% | 11.5% |
Similar Demographics by In Labor Force | Age 20-64
Demographics Similar to Alsatians by In Labor Force | Age 20-64
In terms of in labor force | age 20-64, the demographic groups most similar to Alsatians are Panamanian (79.1%, a difference of 0.0%), Native Hawaiian (79.1%, a difference of 0.0%), Central American (79.1%, a difference of 0.010%), Immigrants from Western Europe (79.1%, a difference of 0.010%), and Portuguese (79.1%, a difference of 0.020%).
| Demographics | Rating | Rank | In Labor Force | Age 20-64 |
| Immigrants | Panama | 6.9 /100 | #222 | Tragic 79.1% |
| Canadians | 6.8 /100 | #223 | Tragic 79.1% |
| Immigrants | Uzbekistan | 6.8 /100 | #224 | Tragic 79.1% |
| Portuguese | 6.4 /100 | #225 | Tragic 79.1% |
| Central Americans | 5.9 /100 | #226 | Tragic 79.1% |
| Immigrants | Western Europe | 5.9 /100 | #227 | Tragic 79.1% |
| Panamanians | 5.7 /100 | #228 | Tragic 79.1% |
| Alsatians | 5.7 /100 | #229 | Tragic 79.1% |
| Native Hawaiians | 5.6 /100 | #230 | Tragic 79.1% |
| Lebanese | 5.1 /100 | #231 | Tragic 79.1% |
| Guamanians/Chamorros | 4.5 /100 | #232 | Tragic 79.1% |
| Japanese | 4.0 /100 | #233 | Tragic 79.1% |
| Immigrants | Canada | 3.2 /100 | #234 | Tragic 79.0% |
| Tlingit-Haida | 3.2 /100 | #235 | Tragic 79.0% |
| Samoans | 2.9 /100 | #236 | Tragic 79.0% |
Demographics Similar to Latvians by In Labor Force | Age 20-64
In terms of in labor force | age 20-64, the demographic groups most similar to Latvians are Czech (80.5%, a difference of 0.010%), Immigrants from Liberia (80.5%, a difference of 0.020%), Brazilian (80.5%, a difference of 0.030%), Immigrants from Zimbabwe (80.5%, a difference of 0.030%), and Ugandan (80.6%, a difference of 0.040%).
| Demographics | Rating | Rank | In Labor Force | Age 20-64 |
| Immigrants | Poland | 99.9 /100 | #35 | Exceptional 80.6% |
| Paraguayans | 99.8 /100 | #36 | Exceptional 80.6% |
| Immigrants | Moldova | 99.8 /100 | #37 | Exceptional 80.6% |
| Ugandans | 99.8 /100 | #38 | Exceptional 80.6% |
| Brazilians | 99.8 /100 | #39 | Exceptional 80.5% |
| Immigrants | Zimbabwe | 99.8 /100 | #40 | Exceptional 80.5% |
| Immigrants | Liberia | 99.8 /100 | #41 | Exceptional 80.5% |
| Latvians | 99.8 /100 | #42 | Exceptional 80.5% |
| Czechs | 99.7 /100 | #43 | Exceptional 80.5% |
| Immigrants | Middle Africa | 99.7 /100 | #44 | Exceptional 80.5% |
| Slovenes | 99.7 /100 | #45 | Exceptional 80.5% |
| Immigrants | Pakistan | 99.6 /100 | #46 | Exceptional 80.5% |
| Immigrants | Africa | 99.6 /100 | #47 | Exceptional 80.4% |
| Immigrants | Hong Kong | 99.5 /100 | #48 | Exceptional 80.4% |
| Immigrants | Greece | 99.4 /100 | #49 | Exceptional 80.4% |