Immigrants from Senegal vs Immigrants from Barbados Unemployment Among Women with Children Ages 6 to 17 years
COMPARE
Immigrants from Senegal
Immigrants from Barbados
Unemployment Among Women with Children Ages 6 to 17 years
Unemployment Among Women with Children Ages 6 to 17 years Comparison
Immigrants from Senegal
Immigrants from Barbados
10.2%
UNEMPLOYMENT AMONG WOMEN WITH CHILDREN AGES 6 TO 17 YEARS
0.0/ 100
METRIC RATING
307th/ 347
METRIC RANK
8.5%
UNEMPLOYMENT AMONG WOMEN WITH CHILDREN AGES 6 TO 17 YEARS
98.8/ 100
METRIC RATING
94th/ 347
METRIC RANK
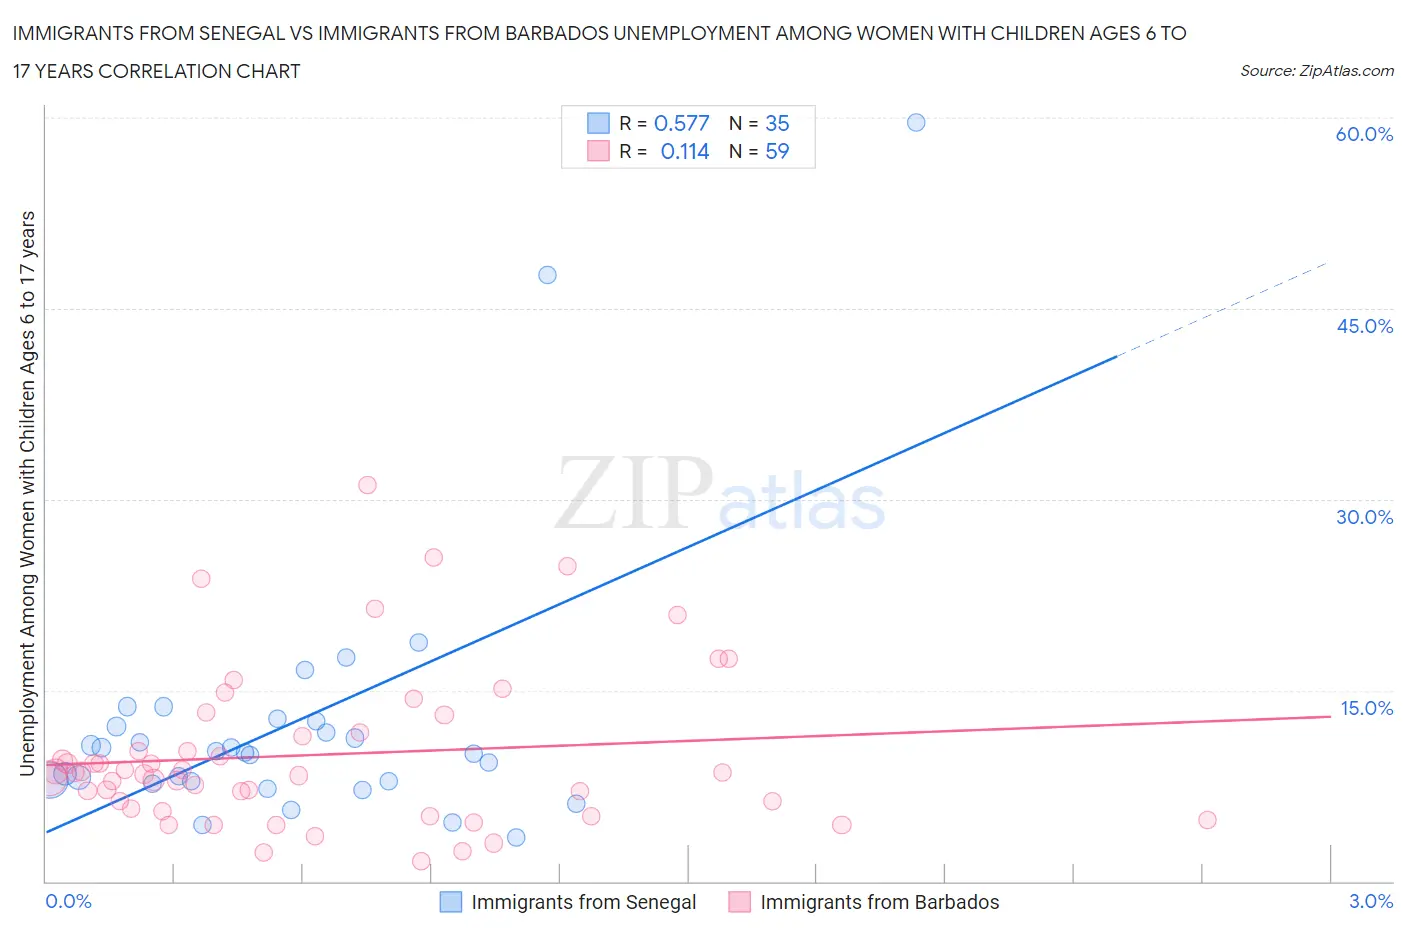
Immigrants from Senegal vs Immigrants from Barbados Unemployment Among Women with Children Ages 6 to 17 years Correlation Chart
The statistical analysis conducted on geographies consisting of 80,966,607 people shows a substantial positive correlation between the proportion of Immigrants from Senegal and unemployment rate among women with children between the ages 6 and 17 in the United States with a correlation coefficient (R) of 0.577 and weighted average of 10.2%. Similarly, the statistical analysis conducted on geographies consisting of 98,607,035 people shows a poor positive correlation between the proportion of Immigrants from Barbados and unemployment rate among women with children between the ages 6 and 17 in the United States with a correlation coefficient (R) of 0.114 and weighted average of 8.5%, a difference of 20.1%.
Unemployment Among Women with Children Ages 6 to 17 years Correlation Summary
| Measurement | Immigrants from Senegal | Immigrants from Barbados |
| Minimum | 3.4% | 1.6% |
| Maximum | 59.6% | 31.1% |
| Range | 56.2% | 29.5% |
| Mean | 12.4% | 9.9% |
| Median | 10.1% | 8.5% |
| Interquartile 25% (IQ1) | 7.8% | 5.7% |
| Interquartile 75% (IQ3) | 12.5% | 11.7% |
| Interquartile Range (IQR) | 4.7% | 6.0% |
| Standard Deviation (Sample) | 11.0% | 6.2% |
| Standard Deviation (Population) | 10.8% | 6.2% |
Similar Demographics by Unemployment Among Women with Children Ages 6 to 17 years
Demographics Similar to Immigrants from Senegal by Unemployment Among Women with Children Ages 6 to 17 years
In terms of unemployment among women with children ages 6 to 17 years, the demographic groups most similar to Immigrants from Senegal are Dutch West Indian (10.2%, a difference of 0.010%), Paraguayan (10.2%, a difference of 0.23%), Immigrants from Nigeria (10.2%, a difference of 0.52%), French Canadian (10.3%, a difference of 0.55%), and Immigrants from Venezuela (10.2%, a difference of 0.57%).
| Demographics | Rating | Rank | Unemployment Among Women with Children Ages 6 to 17 years |
| Nigerians | 0.0 /100 | #300 | Tragic 10.1% |
| Immigrants | Bahamas | 0.0 /100 | #301 | Tragic 10.1% |
| Venezuelans | 0.0 /100 | #302 | Tragic 10.2% |
| Immigrants | Ecuador | 0.0 /100 | #303 | Tragic 10.2% |
| Immigrants | Venezuela | 0.0 /100 | #304 | Tragic 10.2% |
| Immigrants | Nigeria | 0.0 /100 | #305 | Tragic 10.2% |
| Paraguayans | 0.0 /100 | #306 | Tragic 10.2% |
| Immigrants | Senegal | 0.0 /100 | #307 | Tragic 10.2% |
| Dutch West Indians | 0.0 /100 | #308 | Tragic 10.2% |
| French Canadians | 0.0 /100 | #309 | Tragic 10.3% |
| Alaska Natives | 0.0 /100 | #310 | Tragic 10.3% |
| Immigrants | Liberia | 0.0 /100 | #311 | Tragic 10.3% |
| Africans | 0.0 /100 | #312 | Tragic 10.4% |
| Americans | 0.0 /100 | #313 | Tragic 10.4% |
| Immigrants | Cabo Verde | 0.0 /100 | #314 | Tragic 10.4% |
Demographics Similar to Immigrants from Barbados by Unemployment Among Women with Children Ages 6 to 17 years
In terms of unemployment among women with children ages 6 to 17 years, the demographic groups most similar to Immigrants from Barbados are Sri Lankan (8.5%, a difference of 0.060%), Australian (8.5%, a difference of 0.11%), German Russian (8.5%, a difference of 0.12%), Bolivian (8.5%, a difference of 0.21%), and Potawatomi (8.5%, a difference of 0.23%).
| Demographics | Rating | Rank | Unemployment Among Women with Children Ages 6 to 17 years |
| Immigrants | Israel | 99.1 /100 | #87 | Exceptional 8.5% |
| Immigrants | Vietnam | 99.1 /100 | #88 | Exceptional 8.5% |
| Paiute | 99.1 /100 | #89 | Exceptional 8.5% |
| Yugoslavians | 99.0 /100 | #90 | Exceptional 8.5% |
| Immigrants | Eastern Europe | 99.0 /100 | #91 | Exceptional 8.5% |
| Potawatomi | 99.0 /100 | #92 | Exceptional 8.5% |
| Australians | 98.9 /100 | #93 | Exceptional 8.5% |
| Immigrants | Barbados | 98.8 /100 | #94 | Exceptional 8.5% |
| Sri Lankans | 98.7 /100 | #95 | Exceptional 8.5% |
| German Russians | 98.6 /100 | #96 | Exceptional 8.5% |
| Bolivians | 98.5 /100 | #97 | Exceptional 8.5% |
| Malaysians | 98.5 /100 | #98 | Exceptional 8.6% |
| Immigrants | Lithuania | 98.4 /100 | #99 | Exceptional 8.6% |
| New Zealanders | 98.4 /100 | #100 | Exceptional 8.6% |
| Immigrants | Pakistan | 98.4 /100 | #101 | Exceptional 8.6% |