Immigrants from Senegal vs Immigrants from Hong Kong In Labor Force | Age > 16
COMPARE
Immigrants from Senegal
Immigrants from Hong Kong
In Labor Force | Age > 16
In Labor Force | Age > 16 Comparison
Immigrants from Senegal
Immigrants from Hong Kong
66.4%
IN LABOR FORCE | AGE > 16
99.9/ 100
METRIC RATING
56th/ 347
METRIC RANK
65.7%
IN LABOR FORCE | AGE > 16
96.2/ 100
METRIC RATING
120th/ 347
METRIC RANK
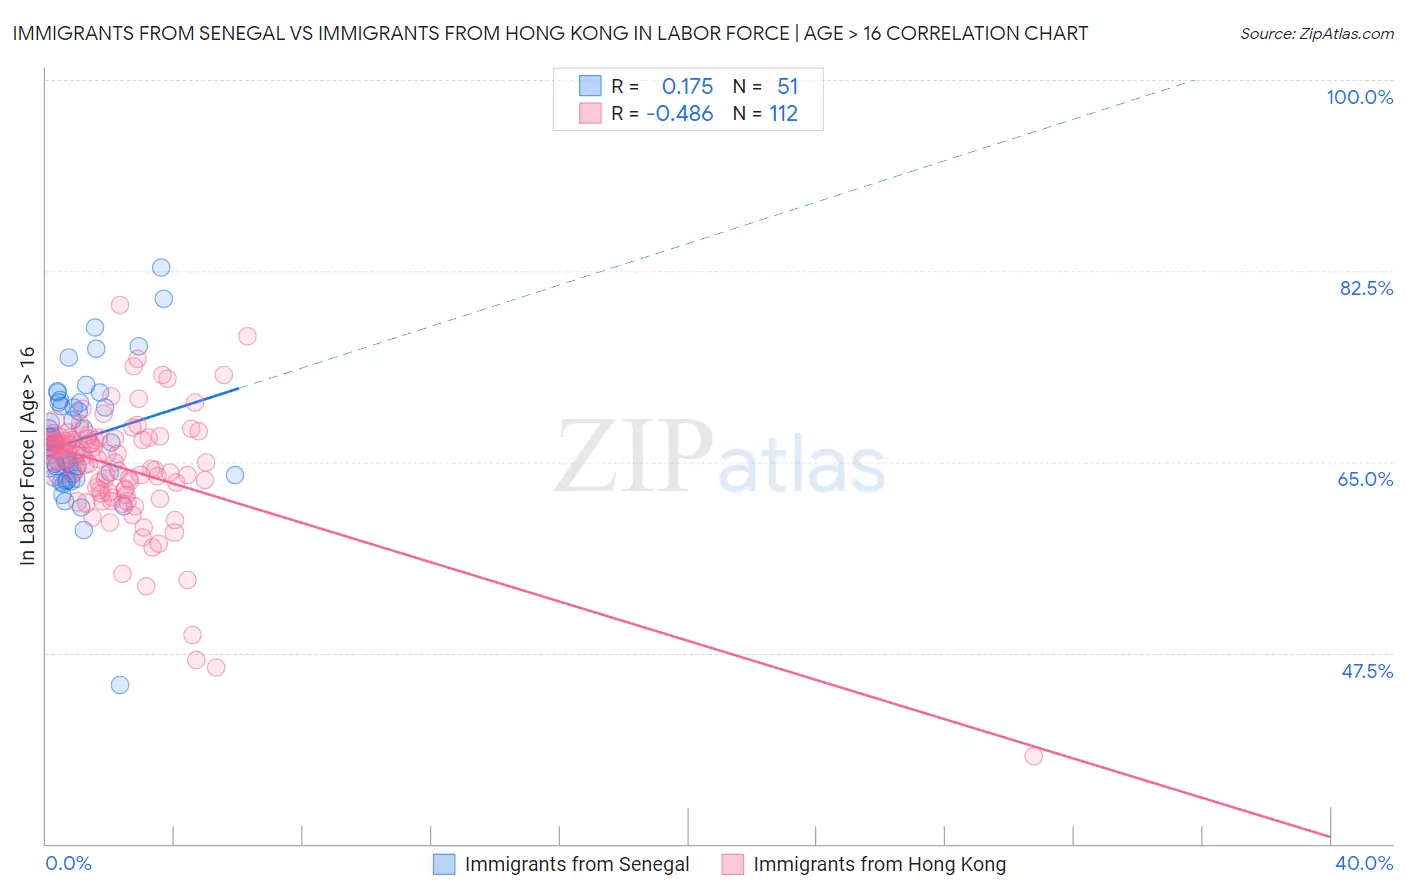
Immigrants from Senegal vs Immigrants from Hong Kong In Labor Force | Age > 16 Correlation Chart
The statistical analysis conducted on geographies consisting of 90,129,295 people shows a poor positive correlation between the proportion of Immigrants from Senegal and labor force participation rate among population ages 16 and over in the United States with a correlation coefficient (R) of 0.175 and weighted average of 66.4%. Similarly, the statistical analysis conducted on geographies consisting of 254,003,180 people shows a moderate negative correlation between the proportion of Immigrants from Hong Kong and labor force participation rate among population ages 16 and over in the United States with a correlation coefficient (R) of -0.486 and weighted average of 65.7%, a difference of 1.1%.
In Labor Force | Age > 16 Correlation Summary
| Measurement | Immigrants from Senegal | Immigrants from Hong Kong |
| Minimum | 44.5% | 38.0% |
| Maximum | 82.8% | 79.4% |
| Range | 38.3% | 41.4% |
| Mean | 67.1% | 64.4% |
| Median | 66.7% | 65.4% |
| Interquartile 25% (IQ1) | 63.6% | 62.3% |
| Interquartile 75% (IQ3) | 70.4% | 67.1% |
| Interquartile Range (IQR) | 6.9% | 4.8% |
| Standard Deviation (Sample) | 5.9% | 5.7% |
| Standard Deviation (Population) | 5.9% | 5.6% |
Similar Demographics by In Labor Force | Age > 16
Demographics Similar to Immigrants from Senegal by In Labor Force | Age > 16
In terms of in labor force | age > 16, the demographic groups most similar to Immigrants from Senegal are Bulgarian (66.4%, a difference of 0.010%), Immigrants from Venezuela (66.4%, a difference of 0.030%), Immigrants from Bosnia and Herzegovina (66.5%, a difference of 0.080%), Immigrants from Sri Lanka (66.5%, a difference of 0.11%), and Immigrants from Saudi Arabia (66.3%, a difference of 0.11%).
| Demographics | Rating | Rank | In Labor Force | Age > 16 |
| Immigrants | Northern Africa | 100.0 /100 | #49 | Exceptional 66.6% |
| Cape Verdeans | 100.0 /100 | #50 | Exceptional 66.6% |
| Immigrants | Kuwait | 100.0 /100 | #51 | Exceptional 66.5% |
| Paraguayans | 99.9 /100 | #52 | Exceptional 66.5% |
| Immigrants | Sri Lanka | 99.9 /100 | #53 | Exceptional 66.5% |
| Immigrants | Bosnia and Herzegovina | 99.9 /100 | #54 | Exceptional 66.5% |
| Immigrants | Venezuela | 99.9 /100 | #55 | Exceptional 66.4% |
| Immigrants | Senegal | 99.9 /100 | #56 | Exceptional 66.4% |
| Bulgarians | 99.9 /100 | #57 | Exceptional 66.4% |
| Immigrants | Saudi Arabia | 99.9 /100 | #58 | Exceptional 66.3% |
| Immigrants | Turkey | 99.9 /100 | #59 | Exceptional 66.3% |
| Immigrants | Peru | 99.8 /100 | #60 | Exceptional 66.3% |
| Immigrants | Burma/Myanmar | 99.8 /100 | #61 | Exceptional 66.3% |
| Indonesians | 99.8 /100 | #62 | Exceptional 66.3% |
| Venezuelans | 99.8 /100 | #63 | Exceptional 66.3% |
Demographics Similar to Immigrants from Hong Kong by In Labor Force | Age > 16
In terms of in labor force | age > 16, the demographic groups most similar to Immigrants from Hong Kong are Immigrants from France (65.7%, a difference of 0.020%), New Zealander (65.7%, a difference of 0.020%), Immigrants from Ecuador (65.7%, a difference of 0.020%), Immigrants from Iran (65.7%, a difference of 0.030%), and Immigrants from Thailand (65.7%, a difference of 0.030%).
| Demographics | Rating | Rank | In Labor Force | Age > 16 |
| Pakistanis | 97.1 /100 | #113 | Exceptional 65.8% |
| Hondurans | 97.1 /100 | #114 | Exceptional 65.8% |
| Immigrants | Indonesia | 96.8 /100 | #115 | Exceptional 65.7% |
| Argentineans | 96.7 /100 | #116 | Exceptional 65.7% |
| Immigrants | Iran | 96.6 /100 | #117 | Exceptional 65.7% |
| Immigrants | Thailand | 96.6 /100 | #118 | Exceptional 65.7% |
| Immigrants | France | 96.4 /100 | #119 | Exceptional 65.7% |
| Immigrants | Hong Kong | 96.2 /100 | #120 | Exceptional 65.7% |
| New Zealanders | 96.0 /100 | #121 | Exceptional 65.7% |
| Immigrants | Ecuador | 95.9 /100 | #122 | Exceptional 65.7% |
| Immigrants | Iraq | 95.5 /100 | #123 | Exceptional 65.7% |
| Iraqis | 95.4 /100 | #124 | Exceptional 65.7% |
| Norwegians | 95.3 /100 | #125 | Exceptional 65.7% |
| Koreans | 95.3 /100 | #126 | Exceptional 65.7% |
| Immigrants | Eastern Asia | 94.9 /100 | #127 | Exceptional 65.7% |