Immigrants from Scotland vs Hopi Seniors Poverty Over the Age of 65
COMPARE
Immigrants from Scotland
Hopi
Seniors Poverty Over the Age of 65
Seniors Poverty Over the Age of 65 Comparison
Immigrants from Scotland
Hopi
9.3%
SENIORS POVERTY OVER THE AGE OF 65
99.9/ 100
METRIC RATING
26th/ 347
METRIC RANK
17.8%
SENIORS POVERTY OVER THE AGE OF 65
0.0/ 100
METRIC RATING
340th/ 347
METRIC RANK
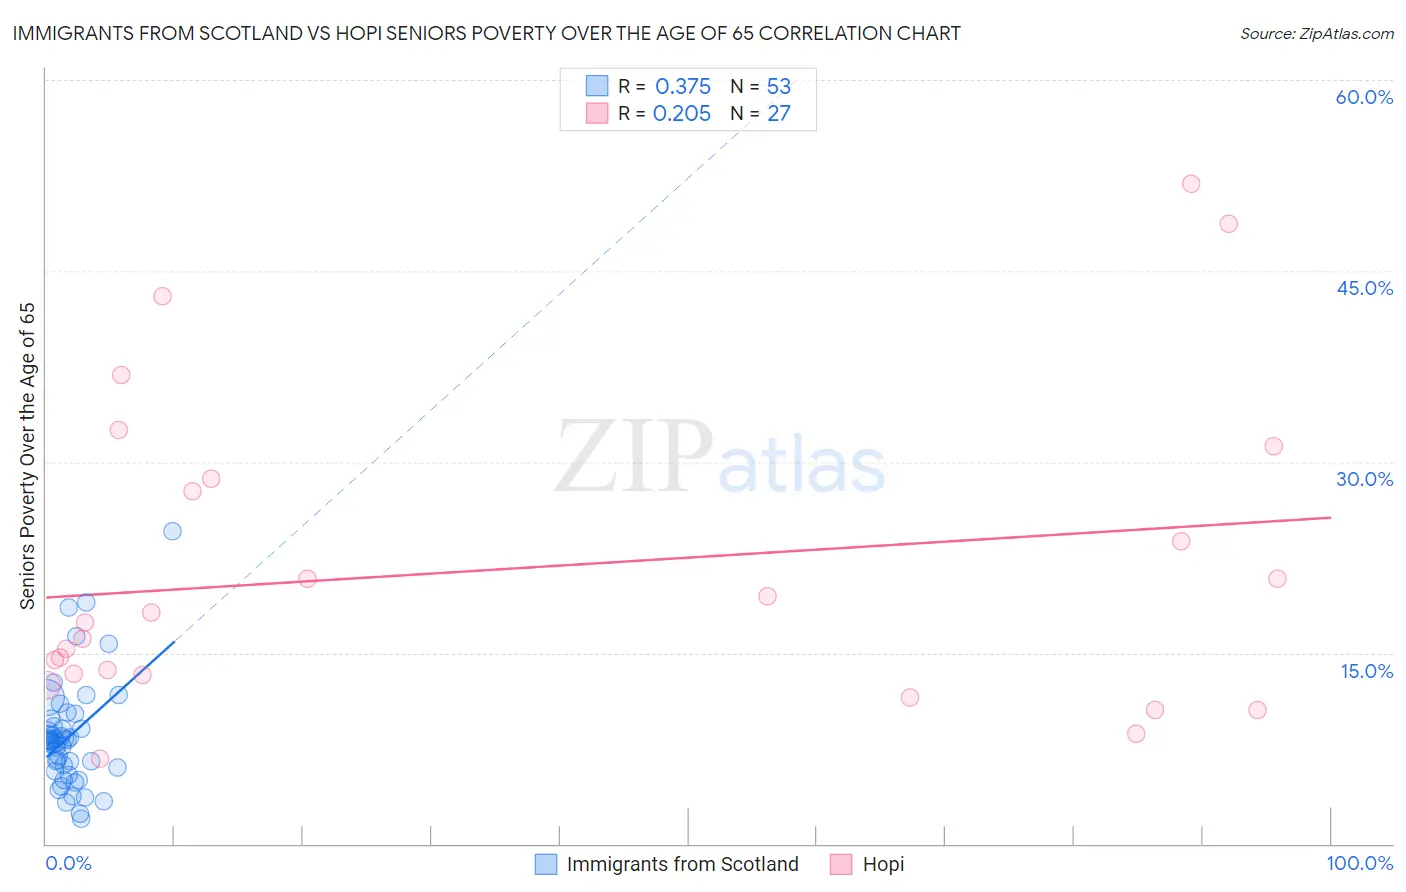
Immigrants from Scotland vs Hopi Seniors Poverty Over the Age of 65 Correlation Chart
The statistical analysis conducted on geographies consisting of 196,224,492 people shows a mild positive correlation between the proportion of Immigrants from Scotland and poverty level among seniors over the age of 65 in the United States with a correlation coefficient (R) of 0.375 and weighted average of 9.3%. Similarly, the statistical analysis conducted on geographies consisting of 74,556,917 people shows a weak positive correlation between the proportion of Hopi and poverty level among seniors over the age of 65 in the United States with a correlation coefficient (R) of 0.205 and weighted average of 17.8%, a difference of 91.4%.
Seniors Poverty Over the Age of 65 Correlation Summary
| Measurement | Immigrants from Scotland | Hopi |
| Minimum | 2.0% | 6.7% |
| Maximum | 24.5% | 51.9% |
| Range | 22.5% | 45.2% |
| Mean | 8.4% | 21.6% |
| Median | 8.1% | 17.4% |
| Interquartile 25% (IQ1) | 5.8% | 13.3% |
| Interquartile 75% (IQ3) | 9.5% | 28.7% |
| Interquartile Range (IQR) | 3.7% | 15.4% |
| Standard Deviation (Sample) | 4.3% | 12.2% |
| Standard Deviation (Population) | 4.2% | 12.0% |
Similar Demographics by Seniors Poverty Over the Age of 65
Demographics Similar to Immigrants from Scotland by Seniors Poverty Over the Age of 65
In terms of seniors poverty over the age of 65, the demographic groups most similar to Immigrants from Scotland are Irish (9.3%, a difference of 0.030%), Italian (9.3%, a difference of 0.080%), Tongan (9.3%, a difference of 0.27%), Bulgarian (9.3%, a difference of 0.30%), and Welsh (9.3%, a difference of 0.38%).
| Demographics | Rating | Rank | Seniors Poverty Over the Age of 65 |
| Swiss | 99.9 /100 | #19 | Exceptional 9.2% |
| Thais | 99.9 /100 | #20 | Exceptional 9.2% |
| Luxembourgers | 99.9 /100 | #21 | Exceptional 9.2% |
| Slovenes | 99.9 /100 | #22 | Exceptional 9.3% |
| Welsh | 99.9 /100 | #23 | Exceptional 9.3% |
| Bulgarians | 99.9 /100 | #24 | Exceptional 9.3% |
| Irish | 99.9 /100 | #25 | Exceptional 9.3% |
| Immigrants | Scotland | 99.9 /100 | #26 | Exceptional 9.3% |
| Italians | 99.9 /100 | #27 | Exceptional 9.3% |
| Tongans | 99.9 /100 | #28 | Exceptional 9.3% |
| Bhutanese | 99.9 /100 | #29 | Exceptional 9.3% |
| Menominee | 99.8 /100 | #30 | Exceptional 9.4% |
| Finns | 99.8 /100 | #31 | Exceptional 9.4% |
| Northern Europeans | 99.8 /100 | #32 | Exceptional 9.4% |
| Native Hawaiians | 99.8 /100 | #33 | Exceptional 9.4% |
Demographics Similar to Hopi by Seniors Poverty Over the Age of 65
In terms of seniors poverty over the age of 65, the demographic groups most similar to Hopi are Dominican (17.8%, a difference of 0.39%), Immigrants from Cuba (17.9%, a difference of 0.87%), Navajo (17.5%, a difference of 1.9%), Lumbee (18.1%, a difference of 2.0%), and Immigrants from Dominican Republic (18.3%, a difference of 2.9%).
| Demographics | Rating | Rank | Seniors Poverty Over the Age of 65 |
| Immigrants | Yemen | 0.0 /100 | #333 | Tragic 15.9% |
| Immigrants | Nicaragua | 0.0 /100 | #334 | Tragic 15.9% |
| Cubans | 0.0 /100 | #335 | Tragic 16.1% |
| Immigrants | Cabo Verde | 0.0 /100 | #336 | Tragic 16.2% |
| Immigrants | Caribbean | 0.0 /100 | #337 | Tragic 16.5% |
| Pueblo | 0.0 /100 | #338 | Tragic 17.2% |
| Navajo | 0.0 /100 | #339 | Tragic 17.5% |
| Hopi | 0.0 /100 | #340 | Tragic 17.8% |
| Dominicans | 0.0 /100 | #341 | Tragic 17.8% |
| Immigrants | Cuba | 0.0 /100 | #342 | Tragic 17.9% |
| Lumbee | 0.0 /100 | #343 | Tragic 18.1% |
| Immigrants | Dominican Republic | 0.0 /100 | #344 | Tragic 18.3% |
| Pima | 0.0 /100 | #345 | Tragic 19.8% |
| Tohono O'odham | 0.0 /100 | #346 | Tragic 20.8% |
| Puerto Ricans | 0.0 /100 | #347 | Tragic 21.4% |