Immigrants from Romania vs Immigrants from Ecuador In Labor Force | Age 20-64
COMPARE
Immigrants from Romania
Immigrants from Ecuador
In Labor Force | Age 20-64
In Labor Force | Age 20-64 Comparison
Immigrants from Romania
Immigrants from Ecuador
80.2%
IN LABOR FORCE | AGE 20-64
97.8/ 100
METRIC RATING
78th/ 347
METRIC RANK
79.3%
IN LABOR FORCE | AGE 20-64
16.9/ 100
METRIC RATING
206th/ 347
METRIC RANK
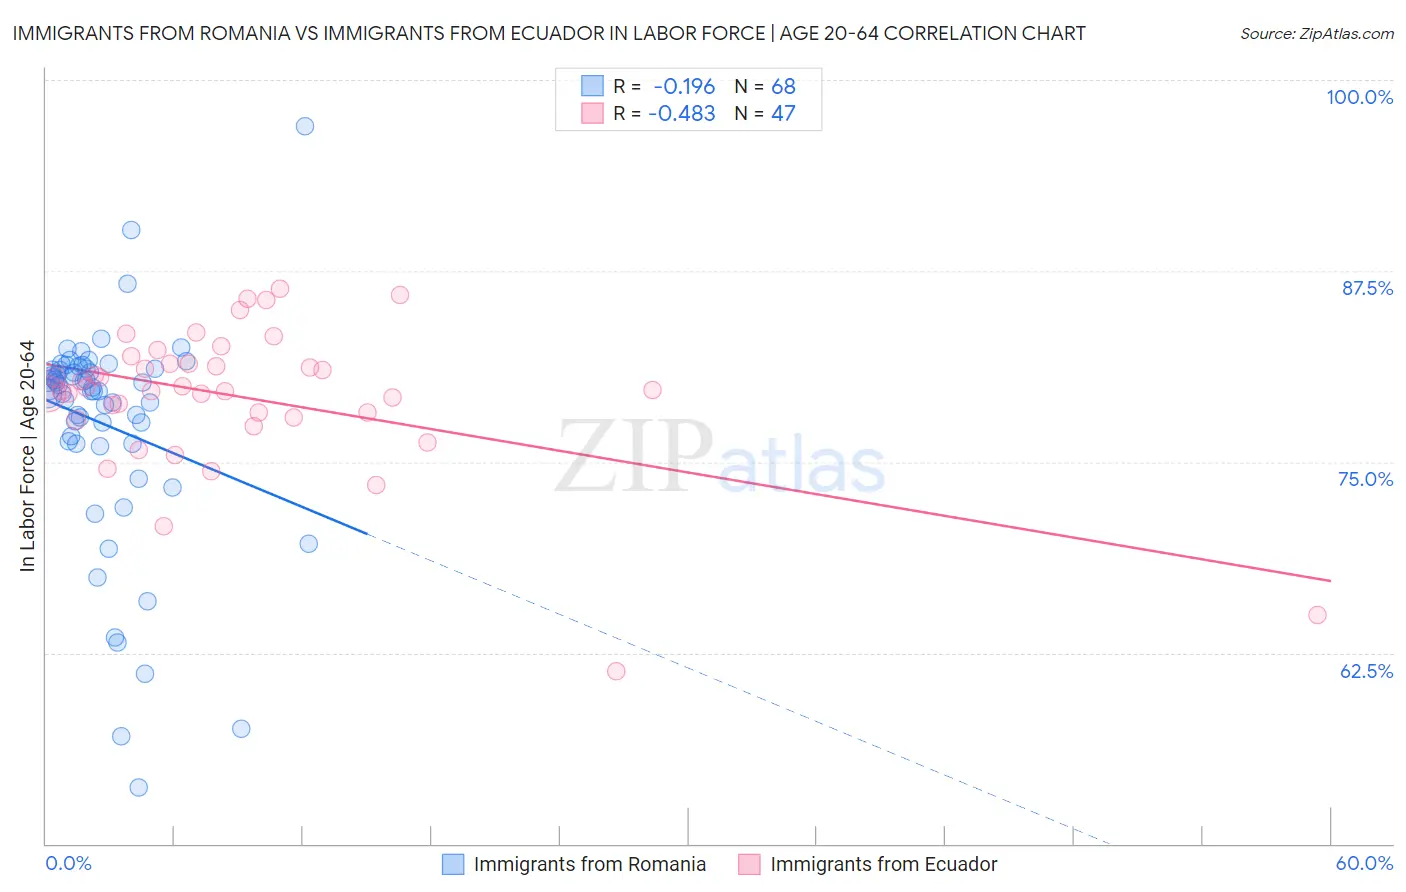
Immigrants from Romania vs Immigrants from Ecuador In Labor Force | Age 20-64 Correlation Chart
The statistical analysis conducted on geographies consisting of 257,013,764 people shows a poor negative correlation between the proportion of Immigrants from Romania and labor force participation rate among population between the ages 20 and 64 in the United States with a correlation coefficient (R) of -0.196 and weighted average of 80.2%. Similarly, the statistical analysis conducted on geographies consisting of 271,016,720 people shows a moderate negative correlation between the proportion of Immigrants from Ecuador and labor force participation rate among population between the ages 20 and 64 in the United States with a correlation coefficient (R) of -0.483 and weighted average of 79.3%, a difference of 1.1%.
In Labor Force | Age 20-64 Correlation Summary
| Measurement | Immigrants from Romania | Immigrants from Ecuador |
| Minimum | 53.7% | 61.3% |
| Maximum | 97.0% | 86.4% |
| Range | 43.3% | 25.1% |
| Mean | 77.4% | 79.3% |
| Median | 79.7% | 79.7% |
| Interquartile 25% (IQ1) | 76.3% | 77.9% |
| Interquartile 75% (IQ3) | 81.0% | 81.4% |
| Interquartile Range (IQR) | 4.8% | 3.5% |
| Standard Deviation (Sample) | 7.3% | 4.8% |
| Standard Deviation (Population) | 7.3% | 4.7% |
Similar Demographics by In Labor Force | Age 20-64
Demographics Similar to Immigrants from Romania by In Labor Force | Age 20-64
In terms of in labor force | age 20-64, the demographic groups most similar to Immigrants from Romania are Egyptian (80.2%, a difference of 0.0%), Immigrants from Colombia (80.2%, a difference of 0.0%), Immigrants from Afghanistan (80.2%, a difference of 0.010%), Asian (80.2%, a difference of 0.010%), and Immigrants from Croatia (80.1%, a difference of 0.020%).
| Demographics | Rating | Rank | In Labor Force | Age 20-64 |
| Soviet Union | 98.5 /100 | #71 | Exceptional 80.2% |
| Eastern Europeans | 98.4 /100 | #72 | Exceptional 80.2% |
| Cypriots | 98.2 /100 | #73 | Exceptional 80.2% |
| Immigrants | Eastern Europe | 98.1 /100 | #74 | Exceptional 80.2% |
| Immigrants | Afghanistan | 97.9 /100 | #75 | Exceptional 80.2% |
| Egyptians | 97.8 /100 | #76 | Exceptional 80.2% |
| Immigrants | Colombia | 97.8 /100 | #77 | Exceptional 80.2% |
| Immigrants | Romania | 97.8 /100 | #78 | Exceptional 80.2% |
| Asians | 97.7 /100 | #79 | Exceptional 80.2% |
| Immigrants | Croatia | 97.6 /100 | #80 | Exceptional 80.1% |
| German Russians | 97.3 /100 | #81 | Exceptional 80.1% |
| Immigrants | Japan | 97.3 /100 | #82 | Exceptional 80.1% |
| Colombians | 97.3 /100 | #83 | Exceptional 80.1% |
| Immigrants | Latvia | 97.2 /100 | #84 | Exceptional 80.1% |
| Jordanians | 97.2 /100 | #85 | Exceptional 80.1% |
Demographics Similar to Immigrants from Ecuador by In Labor Force | Age 20-64
In terms of in labor force | age 20-64, the demographic groups most similar to Immigrants from Ecuador are Subsaharan African (79.3%, a difference of 0.0%), Iraqi (79.3%, a difference of 0.010%), Immigrants from Cambodia (79.3%, a difference of 0.010%), Immigrants from Congo (79.3%, a difference of 0.010%), and British (79.3%, a difference of 0.010%).
| Demographics | Rating | Rank | In Labor Force | Age 20-64 |
| Dutch | 20.2 /100 | #199 | Fair 79.3% |
| Immigrants | Oceania | 19.1 /100 | #200 | Poor 79.3% |
| Immigrants | Nicaragua | 19.0 /100 | #201 | Poor 79.3% |
| Nicaraguans | 18.3 /100 | #202 | Poor 79.3% |
| Iraqis | 17.7 /100 | #203 | Poor 79.3% |
| Immigrants | Cambodia | 17.6 /100 | #204 | Poor 79.3% |
| Immigrants | Congo | 17.5 /100 | #205 | Poor 79.3% |
| Immigrants | Ecuador | 16.9 /100 | #206 | Poor 79.3% |
| Sub-Saharan Africans | 16.5 /100 | #207 | Poor 79.3% |
| British | 16.5 /100 | #208 | Poor 79.3% |
| Bangladeshis | 16.4 /100 | #209 | Poor 79.3% |
| Haitians | 16.1 /100 | #210 | Poor 79.3% |
| Europeans | 15.3 /100 | #211 | Poor 79.3% |
| Irish | 13.2 /100 | #212 | Poor 79.3% |
| Immigrants | Portugal | 12.8 /100 | #213 | Poor 79.3% |