Immigrants from Portugal vs Delaware In Labor Force | Age 20-64
COMPARE
Immigrants from Portugal
Delaware
In Labor Force | Age 20-64
In Labor Force | Age 20-64 Comparison
Immigrants from Portugal
Delaware
79.3%
IN LABOR FORCE | AGE 20-64
12.8/ 100
METRIC RATING
213th/ 347
METRIC RANK
77.8%
IN LABOR FORCE | AGE 20-64
0.0/ 100
METRIC RATING
293rd/ 347
METRIC RANK
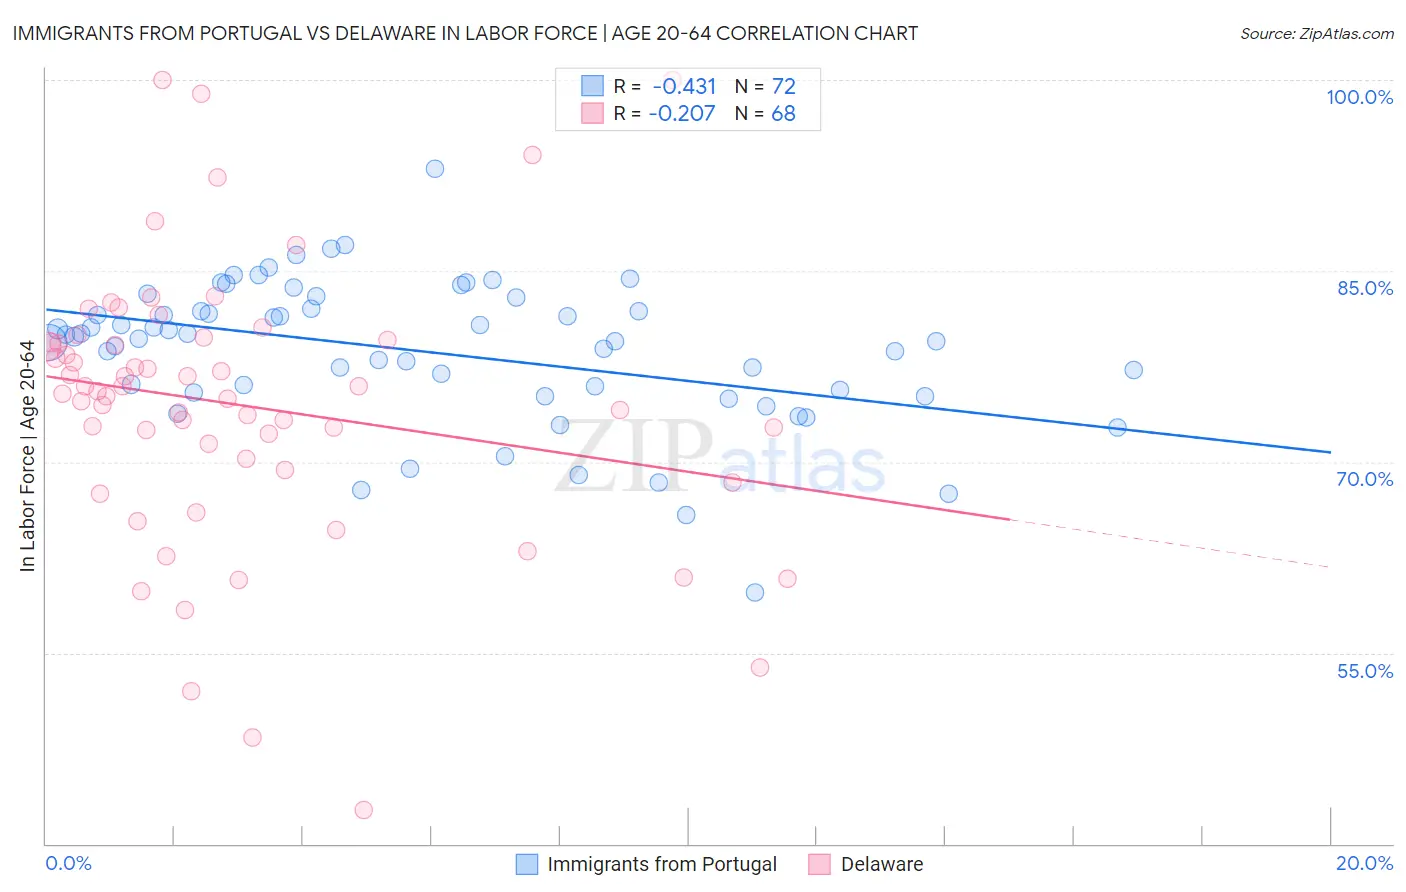
Immigrants from Portugal vs Delaware In Labor Force | Age 20-64 Correlation Chart
The statistical analysis conducted on geographies consisting of 174,779,205 people shows a moderate negative correlation between the proportion of Immigrants from Portugal and labor force participation rate among population between the ages 20 and 64 in the United States with a correlation coefficient (R) of -0.431 and weighted average of 79.3%. Similarly, the statistical analysis conducted on geographies consisting of 96,240,999 people shows a weak negative correlation between the proportion of Delaware and labor force participation rate among population between the ages 20 and 64 in the United States with a correlation coefficient (R) of -0.207 and weighted average of 77.8%, a difference of 1.9%.
In Labor Force | Age 20-64 Correlation Summary
| Measurement | Immigrants from Portugal | Delaware |
| Minimum | 59.7% | 42.7% |
| Maximum | 93.0% | 100.0% |
| Range | 33.3% | 57.3% |
| Mean | 78.7% | 74.5% |
| Median | 79.7% | 75.4% |
| Interquartile 25% (IQ1) | 75.5% | 69.8% |
| Interquartile 75% (IQ3) | 82.0% | 79.5% |
| Interquartile Range (IQR) | 6.4% | 9.7% |
| Standard Deviation (Sample) | 5.6% | 10.9% |
| Standard Deviation (Population) | 5.6% | 10.8% |
Similar Demographics by In Labor Force | Age 20-64
Demographics Similar to Immigrants from Portugal by In Labor Force | Age 20-64
In terms of in labor force | age 20-64, the demographic groups most similar to Immigrants from Portugal are Irish (79.3%, a difference of 0.010%), Immigrants from Armenia (79.2%, a difference of 0.010%), Immigrants from Norway (79.2%, a difference of 0.020%), Arab (79.2%, a difference of 0.030%), and Immigrants from Western Asia (79.2%, a difference of 0.030%).
| Demographics | Rating | Rank | In Labor Force | Age 20-64 |
| Immigrants | Ecuador | 16.9 /100 | #206 | Poor 79.3% |
| Sub-Saharan Africans | 16.5 /100 | #207 | Poor 79.3% |
| British | 16.5 /100 | #208 | Poor 79.3% |
| Bangladeshis | 16.4 /100 | #209 | Poor 79.3% |
| Haitians | 16.1 /100 | #210 | Poor 79.3% |
| Europeans | 15.3 /100 | #211 | Poor 79.3% |
| Irish | 13.2 /100 | #212 | Poor 79.3% |
| Immigrants | Portugal | 12.8 /100 | #213 | Poor 79.3% |
| Immigrants | Armenia | 12.2 /100 | #214 | Poor 79.2% |
| Immigrants | Norway | 12.0 /100 | #215 | Poor 79.2% |
| Arabs | 11.4 /100 | #216 | Poor 79.2% |
| Immigrants | Western Asia | 11.0 /100 | #217 | Poor 79.2% |
| Immigrants | England | 9.3 /100 | #218 | Tragic 79.2% |
| French Canadians | 8.4 /100 | #219 | Tragic 79.2% |
| Immigrants | Immigrants | 7.7 /100 | #220 | Tragic 79.2% |
Demographics Similar to Delaware by In Labor Force | Age 20-64
In terms of in labor force | age 20-64, the demographic groups most similar to Delaware are Immigrants from the Azores (77.8%, a difference of 0.040%), Spanish American (77.8%, a difference of 0.090%), Immigrants from Central America (77.7%, a difference of 0.090%), Immigrants from Grenada (77.7%, a difference of 0.12%), and Immigrants from Bangladesh (77.9%, a difference of 0.14%).
| Demographics | Rating | Rank | In Labor Force | Age 20-64 |
| Immigrants | Belize | 0.0 /100 | #286 | Tragic 78.0% |
| Vietnamese | 0.0 /100 | #287 | Tragic 78.0% |
| Hmong | 0.0 /100 | #288 | Tragic 77.9% |
| Africans | 0.0 /100 | #289 | Tragic 77.9% |
| Immigrants | Bangladesh | 0.0 /100 | #290 | Tragic 77.9% |
| Spanish Americans | 0.0 /100 | #291 | Tragic 77.8% |
| Immigrants | Azores | 0.0 /100 | #292 | Tragic 77.8% |
| Delaware | 0.0 /100 | #293 | Tragic 77.8% |
| Immigrants | Central America | 0.0 /100 | #294 | Tragic 77.7% |
| Immigrants | Grenada | 0.0 /100 | #295 | Tragic 77.7% |
| Immigrants | Dominican Republic | 0.0 /100 | #296 | Tragic 77.7% |
| Dominicans | 0.0 /100 | #297 | Tragic 77.7% |
| Cree | 0.0 /100 | #298 | Tragic 77.7% |
| Hispanics or Latinos | 0.0 /100 | #299 | Tragic 77.6% |
| Spanish American Indians | 0.0 /100 | #300 | Tragic 77.6% |