Immigrants from Portugal vs Immigrants from Egypt In Labor Force | Age 20-64
COMPARE
Immigrants from Portugal
Immigrants from Egypt
In Labor Force | Age 20-64
In Labor Force | Age 20-64 Comparison
Immigrants from Portugal
Immigrants from Egypt
79.3%
IN LABOR FORCE | AGE 20-64
12.8/ 100
METRIC RATING
213th/ 347
METRIC RANK
80.1%
IN LABOR FORCE | AGE 20-64
97.1/ 100
METRIC RATING
86th/ 347
METRIC RANK
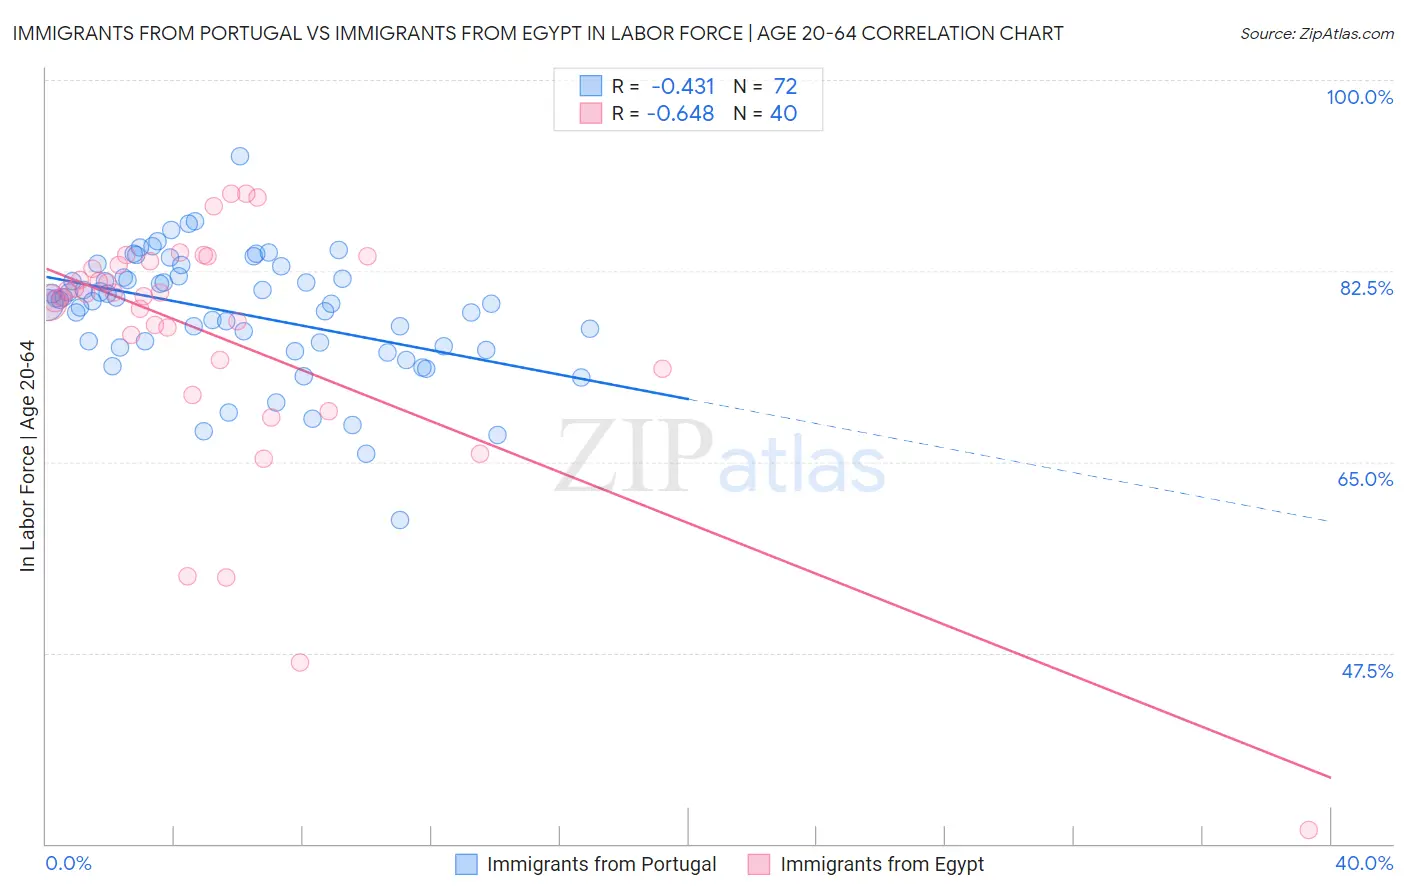
Immigrants from Portugal vs Immigrants from Egypt In Labor Force | Age 20-64 Correlation Chart
The statistical analysis conducted on geographies consisting of 174,779,205 people shows a moderate negative correlation between the proportion of Immigrants from Portugal and labor force participation rate among population between the ages 20 and 64 in the United States with a correlation coefficient (R) of -0.431 and weighted average of 79.3%. Similarly, the statistical analysis conducted on geographies consisting of 245,492,161 people shows a significant negative correlation between the proportion of Immigrants from Egypt and labor force participation rate among population between the ages 20 and 64 in the United States with a correlation coefficient (R) of -0.648 and weighted average of 80.1%, a difference of 1.1%.
In Labor Force | Age 20-64 Correlation Summary
| Measurement | Immigrants from Portugal | Immigrants from Egypt |
| Minimum | 59.7% | 31.3% |
| Maximum | 93.0% | 89.6% |
| Range | 33.3% | 58.3% |
| Mean | 78.7% | 76.4% |
| Median | 79.7% | 80.3% |
| Interquartile 25% (IQ1) | 75.5% | 73.9% |
| Interquartile 75% (IQ3) | 82.0% | 83.2% |
| Interquartile Range (IQR) | 6.4% | 9.3% |
| Standard Deviation (Sample) | 5.6% | 11.9% |
| Standard Deviation (Population) | 5.6% | 11.8% |
Similar Demographics by In Labor Force | Age 20-64
Demographics Similar to Immigrants from Portugal by In Labor Force | Age 20-64
In terms of in labor force | age 20-64, the demographic groups most similar to Immigrants from Portugal are Irish (79.3%, a difference of 0.010%), Immigrants from Armenia (79.2%, a difference of 0.010%), Immigrants from Norway (79.2%, a difference of 0.020%), Arab (79.2%, a difference of 0.030%), and Immigrants from Western Asia (79.2%, a difference of 0.030%).
| Demographics | Rating | Rank | In Labor Force | Age 20-64 |
| Immigrants | Ecuador | 16.9 /100 | #206 | Poor 79.3% |
| Sub-Saharan Africans | 16.5 /100 | #207 | Poor 79.3% |
| British | 16.5 /100 | #208 | Poor 79.3% |
| Bangladeshis | 16.4 /100 | #209 | Poor 79.3% |
| Haitians | 16.1 /100 | #210 | Poor 79.3% |
| Europeans | 15.3 /100 | #211 | Poor 79.3% |
| Irish | 13.2 /100 | #212 | Poor 79.3% |
| Immigrants | Portugal | 12.8 /100 | #213 | Poor 79.3% |
| Immigrants | Armenia | 12.2 /100 | #214 | Poor 79.2% |
| Immigrants | Norway | 12.0 /100 | #215 | Poor 79.2% |
| Arabs | 11.4 /100 | #216 | Poor 79.2% |
| Immigrants | Western Asia | 11.0 /100 | #217 | Poor 79.2% |
| Immigrants | England | 9.3 /100 | #218 | Tragic 79.2% |
| French Canadians | 8.4 /100 | #219 | Tragic 79.2% |
| Immigrants | Immigrants | 7.7 /100 | #220 | Tragic 79.2% |
Demographics Similar to Immigrants from Egypt by In Labor Force | Age 20-64
In terms of in labor force | age 20-64, the demographic groups most similar to Immigrants from Egypt are Jordanian (80.1%, a difference of 0.0%), Croatian (80.1%, a difference of 0.0%), German Russian (80.1%, a difference of 0.010%), Immigrants from Japan (80.1%, a difference of 0.010%), and Colombian (80.1%, a difference of 0.010%).
| Demographics | Rating | Rank | In Labor Force | Age 20-64 |
| Asians | 97.7 /100 | #79 | Exceptional 80.2% |
| Immigrants | Croatia | 97.6 /100 | #80 | Exceptional 80.1% |
| German Russians | 97.3 /100 | #81 | Exceptional 80.1% |
| Immigrants | Japan | 97.3 /100 | #82 | Exceptional 80.1% |
| Colombians | 97.3 /100 | #83 | Exceptional 80.1% |
| Immigrants | Latvia | 97.2 /100 | #84 | Exceptional 80.1% |
| Jordanians | 97.2 /100 | #85 | Exceptional 80.1% |
| Immigrants | Egypt | 97.1 /100 | #86 | Exceptional 80.1% |
| Croatians | 97.1 /100 | #87 | Exceptional 80.1% |
| Chileans | 97.0 /100 | #88 | Exceptional 80.1% |
| Immigrants | Venezuela | 96.8 /100 | #89 | Exceptional 80.1% |
| Poles | 96.8 /100 | #90 | Exceptional 80.1% |
| Uruguayans | 96.7 /100 | #91 | Exceptional 80.1% |
| Ghanaians | 96.7 /100 | #92 | Exceptional 80.1% |
| Immigrants | Belarus | 96.4 /100 | #93 | Exceptional 80.1% |