Immigrants from Portugal vs Immigrants from Israel In Labor Force | Age > 16
COMPARE
Immigrants from Portugal
Immigrants from Israel
In Labor Force | Age > 16
In Labor Force | Age > 16 Comparison
Immigrants from Portugal
Immigrants from Israel
65.0%
IN LABOR FORCE | AGE > 16
34.8/ 100
METRIC RATING
188th/ 347
METRIC RANK
65.2%
IN LABOR FORCE | AGE > 16
61.7/ 100
METRIC RATING
170th/ 347
METRIC RANK
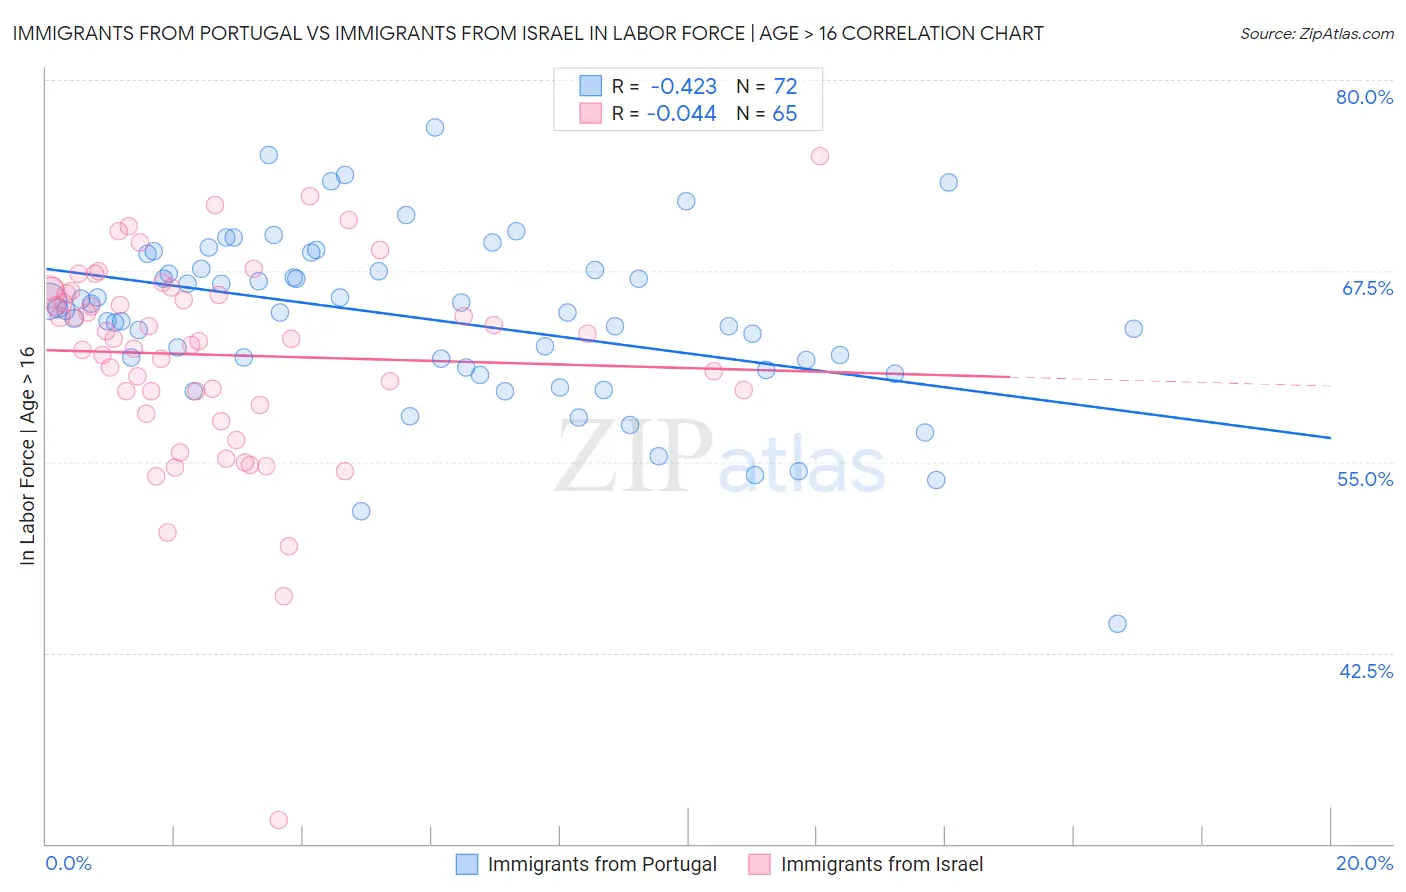
Immigrants from Portugal vs Immigrants from Israel In Labor Force | Age > 16 Correlation Chart
The statistical analysis conducted on geographies consisting of 174,779,205 people shows a moderate negative correlation between the proportion of Immigrants from Portugal and labor force participation rate among population ages 16 and over in the United States with a correlation coefficient (R) of -0.423 and weighted average of 65.0%. Similarly, the statistical analysis conducted on geographies consisting of 210,034,419 people shows no correlation between the proportion of Immigrants from Israel and labor force participation rate among population ages 16 and over in the United States with a correlation coefficient (R) of -0.044 and weighted average of 65.2%, a difference of 0.31%.
In Labor Force | Age > 16 Correlation Summary
| Measurement | Immigrants from Portugal | Immigrants from Israel |
| Minimum | 44.4% | 31.5% |
| Maximum | 76.9% | 75.0% |
| Range | 32.5% | 43.5% |
| Mean | 64.4% | 62.0% |
| Median | 64.9% | 63.1% |
| Interquartile 25% (IQ1) | 61.5% | 59.2% |
| Interquartile 75% (IQ3) | 67.6% | 66.1% |
| Interquartile Range (IQR) | 6.2% | 7.0% |
| Standard Deviation (Sample) | 5.7% | 6.9% |
| Standard Deviation (Population) | 5.6% | 6.8% |
Demographics Similar to Immigrants from Portugal and Immigrants from Israel by In Labor Force | Age > 16
In terms of in labor force | age > 16, the demographic groups most similar to Immigrants from Portugal are Immigrants from Croatia (65.0%, a difference of 0.010%), Immigrants from Greece (65.0%, a difference of 0.010%), Immigrants from Switzerland (65.0%, a difference of 0.040%), Carpatho Rusyn (65.0%, a difference of 0.060%), and Syrian (65.0%, a difference of 0.060%). Similarly, the demographic groups most similar to Immigrants from Israel are Israeli (65.2%, a difference of 0.0%), Immigrants from Sweden (65.2%, a difference of 0.0%), Arab (65.2%, a difference of 0.010%), Immigrants from Ukraine (65.1%, a difference of 0.090%), and Macedonian (65.1%, a difference of 0.13%).
| Demographics | Rating | Rank | In Labor Force | Age > 16 |
| Arabs | 62.4 /100 | #169 | Good 65.2% |
| Immigrants | Israel | 61.7 /100 | #170 | Good 65.2% |
| Israelis | 61.6 /100 | #171 | Good 65.2% |
| Immigrants | Sweden | 61.3 /100 | #172 | Good 65.2% |
| Immigrants | Ukraine | 53.7 /100 | #173 | Average 65.1% |
| Macedonians | 50.0 /100 | #174 | Average 65.1% |
| Nicaraguans | 49.7 /100 | #175 | Average 65.1% |
| Swedes | 47.4 /100 | #176 | Average 65.1% |
| Eastern Europeans | 46.2 /100 | #177 | Average 65.1% |
| Trinidadians and Tobagonians | 45.2 /100 | #178 | Average 65.1% |
| Immigrants | Haiti | 43.3 /100 | #179 | Average 65.1% |
| Immigrants | Latvia | 42.9 /100 | #180 | Average 65.1% |
| Immigrants | Panama | 42.4 /100 | #181 | Average 65.1% |
| Immigrants | Nicaragua | 41.1 /100 | #182 | Average 65.1% |
| Soviet Union | 40.5 /100 | #183 | Average 65.0% |
| Carpatho Rusyns | 40.0 /100 | #184 | Average 65.0% |
| Syrians | 40.0 /100 | #185 | Average 65.0% |
| Immigrants | Switzerland | 38.2 /100 | #186 | Fair 65.0% |
| Immigrants | Croatia | 35.7 /100 | #187 | Fair 65.0% |
| Immigrants | Portugal | 34.8 /100 | #188 | Fair 65.0% |
| Immigrants | Greece | 34.3 /100 | #189 | Fair 65.0% |