Immigrants from Poland vs Immigrants from Cabo Verde In Labor Force | Age 20-64
COMPARE
Immigrants from Poland
Immigrants from Cabo Verde
In Labor Force | Age 20-64
In Labor Force | Age 20-64 Comparison
Immigrants from Poland
Immigrants from Cabo Verde
80.6%
IN LABOR FORCE | AGE 20-64
99.9/ 100
METRIC RATING
35th/ 347
METRIC RANK
80.3%
IN LABOR FORCE | AGE 20-64
99.0/ 100
METRIC RATING
55th/ 347
METRIC RANK
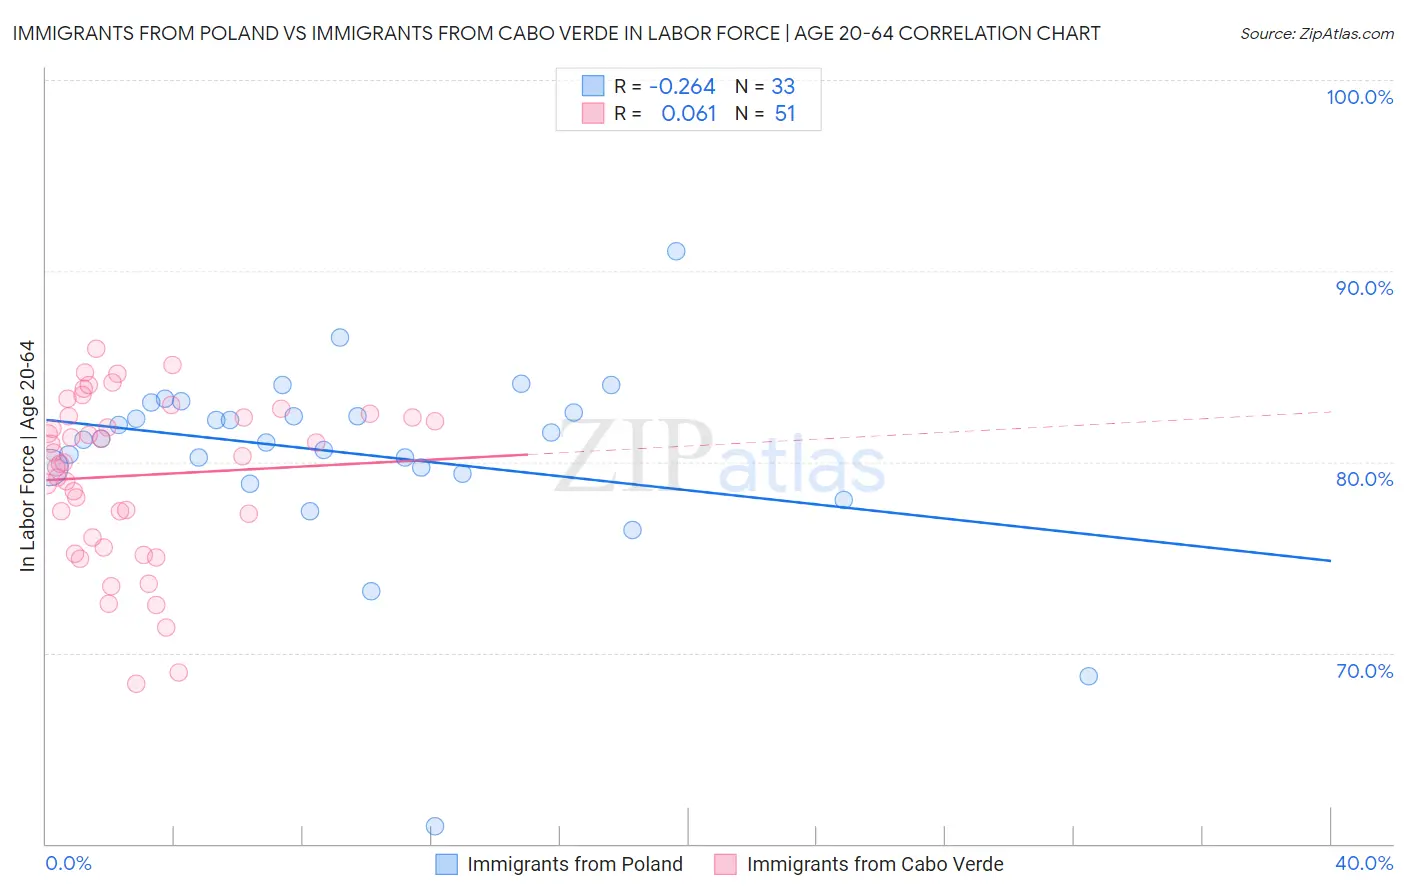
Immigrants from Poland vs Immigrants from Cabo Verde In Labor Force | Age 20-64 Correlation Chart
The statistical analysis conducted on geographies consisting of 304,860,886 people shows a weak negative correlation between the proportion of Immigrants from Poland and labor force participation rate among population between the ages 20 and 64 in the United States with a correlation coefficient (R) of -0.264 and weighted average of 80.6%. Similarly, the statistical analysis conducted on geographies consisting of 38,158,316 people shows a slight positive correlation between the proportion of Immigrants from Cabo Verde and labor force participation rate among population between the ages 20 and 64 in the United States with a correlation coefficient (R) of 0.061 and weighted average of 80.3%, a difference of 0.41%.
In Labor Force | Age 20-64 Correlation Summary
| Measurement | Immigrants from Poland | Immigrants from Cabo Verde |
| Minimum | 60.9% | 68.4% |
| Maximum | 91.0% | 85.9% |
| Range | 30.1% | 17.5% |
| Mean | 80.4% | 79.3% |
| Median | 81.2% | 80.3% |
| Interquartile 25% (IQ1) | 79.5% | 76.0% |
| Interquartile 75% (IQ3) | 82.9% | 82.4% |
| Interquartile Range (IQR) | 3.3% | 6.4% |
| Standard Deviation (Sample) | 5.1% | 4.3% |
| Standard Deviation (Population) | 5.1% | 4.2% |
Demographics Similar to Immigrants from Poland and Immigrants from Cabo Verde by In Labor Force | Age 20-64
In terms of in labor force | age 20-64, the demographic groups most similar to Immigrants from Poland are Paraguayan (80.6%, a difference of 0.070%), Immigrants from Moldova (80.6%, a difference of 0.070%), Ugandan (80.6%, a difference of 0.090%), Brazilian (80.5%, a difference of 0.10%), and Immigrants from Zimbabwe (80.5%, a difference of 0.10%). Similarly, the demographic groups most similar to Immigrants from Cabo Verde are Peruvian (80.3%, a difference of 0.020%), Immigrants from Peru (80.3%, a difference of 0.040%), Turkish (80.3%, a difference of 0.050%), Immigrants from Sri Lanka (80.4%, a difference of 0.070%), and Immigrants from Sudan (80.4%, a difference of 0.090%).
| Demographics | Rating | Rank | In Labor Force | Age 20-64 |
| Immigrants | Poland | 99.9 /100 | #35 | Exceptional 80.6% |
| Paraguayans | 99.8 /100 | #36 | Exceptional 80.6% |
| Immigrants | Moldova | 99.8 /100 | #37 | Exceptional 80.6% |
| Ugandans | 99.8 /100 | #38 | Exceptional 80.6% |
| Brazilians | 99.8 /100 | #39 | Exceptional 80.5% |
| Immigrants | Zimbabwe | 99.8 /100 | #40 | Exceptional 80.5% |
| Immigrants | Liberia | 99.8 /100 | #41 | Exceptional 80.5% |
| Latvians | 99.8 /100 | #42 | Exceptional 80.5% |
| Czechs | 99.7 /100 | #43 | Exceptional 80.5% |
| Immigrants | Middle Africa | 99.7 /100 | #44 | Exceptional 80.5% |
| Slovenes | 99.7 /100 | #45 | Exceptional 80.5% |
| Immigrants | Pakistan | 99.6 /100 | #46 | Exceptional 80.5% |
| Immigrants | Africa | 99.6 /100 | #47 | Exceptional 80.4% |
| Immigrants | Hong Kong | 99.5 /100 | #48 | Exceptional 80.4% |
| Immigrants | Greece | 99.4 /100 | #49 | Exceptional 80.4% |
| Immigrants | Sudan | 99.4 /100 | #50 | Exceptional 80.4% |
| Immigrants | Sri Lanka | 99.3 /100 | #51 | Exceptional 80.4% |
| Turks | 99.2 /100 | #52 | Exceptional 80.3% |
| Immigrants | Peru | 99.2 /100 | #53 | Exceptional 80.3% |
| Peruvians | 99.1 /100 | #54 | Exceptional 80.3% |
| Immigrants | Cabo Verde | 99.0 /100 | #55 | Exceptional 80.3% |