Immigrants from Poland vs Immigrants from Latin America In Labor Force | Age 20-64
COMPARE
Immigrants from Poland
Immigrants from Latin America
In Labor Force | Age 20-64
In Labor Force | Age 20-64 Comparison
Immigrants from Poland
Immigrants from Latin America
80.6%
IN LABOR FORCE | AGE 20-64
99.9/ 100
METRIC RATING
35th/ 347
METRIC RANK
78.3%
IN LABOR FORCE | AGE 20-64
0.0/ 100
METRIC RATING
271st/ 347
METRIC RANK
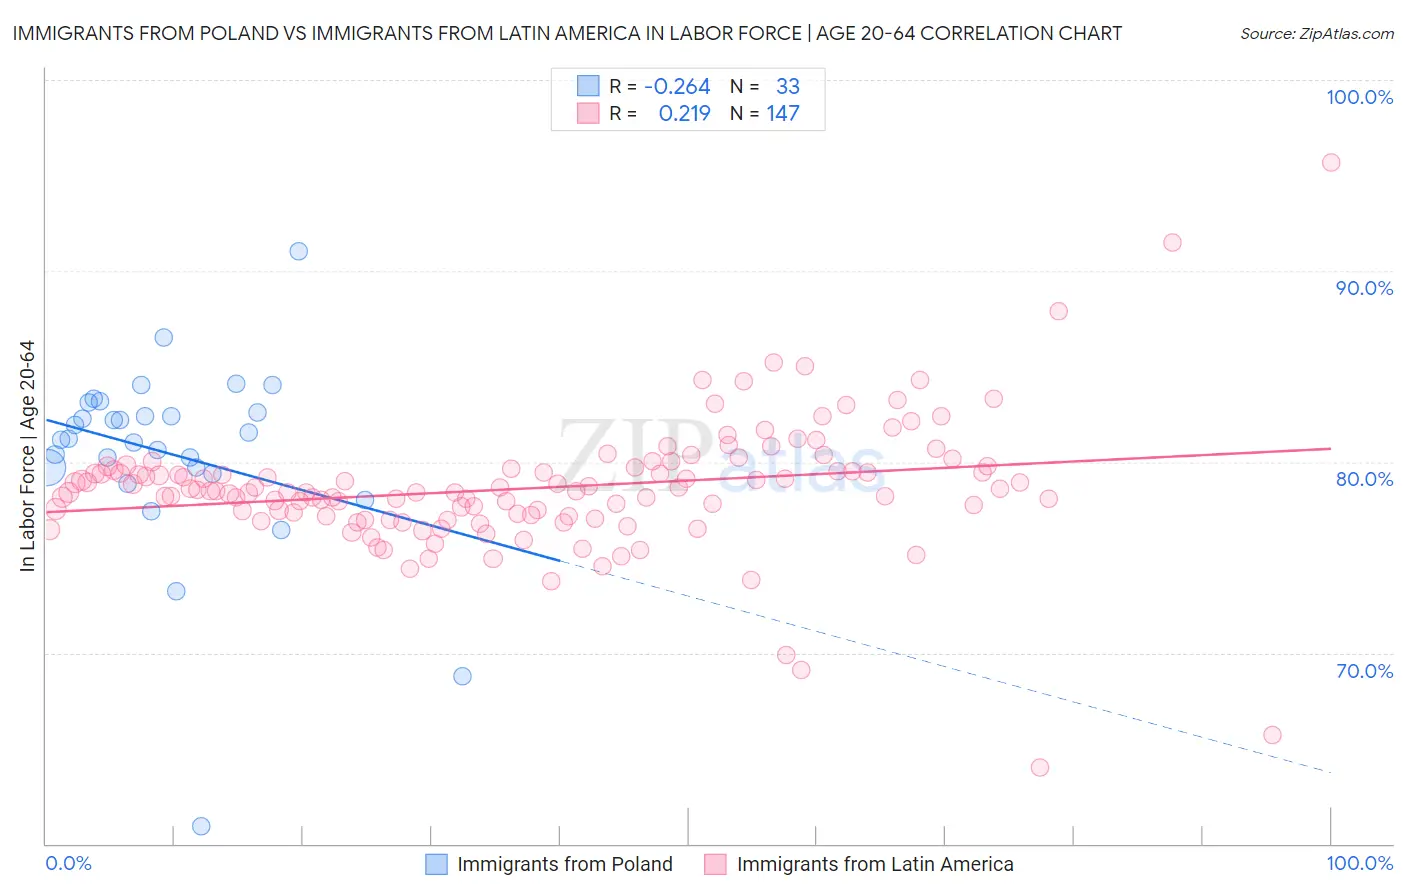
Immigrants from Poland vs Immigrants from Latin America In Labor Force | Age 20-64 Correlation Chart
The statistical analysis conducted on geographies consisting of 304,860,886 people shows a weak negative correlation between the proportion of Immigrants from Poland and labor force participation rate among population between the ages 20 and 64 in the United States with a correlation coefficient (R) of -0.264 and weighted average of 80.6%. Similarly, the statistical analysis conducted on geographies consisting of 558,614,775 people shows a weak positive correlation between the proportion of Immigrants from Latin America and labor force participation rate among population between the ages 20 and 64 in the United States with a correlation coefficient (R) of 0.219 and weighted average of 78.3%, a difference of 3.0%.
In Labor Force | Age 20-64 Correlation Summary
| Measurement | Immigrants from Poland | Immigrants from Latin America |
| Minimum | 60.9% | 64.0% |
| Maximum | 91.0% | 95.7% |
| Range | 30.1% | 31.7% |
| Mean | 80.4% | 78.6% |
| Median | 81.2% | 78.5% |
| Interquartile 25% (IQ1) | 79.5% | 77.2% |
| Interquartile 75% (IQ3) | 82.9% | 79.6% |
| Interquartile Range (IQR) | 3.3% | 2.4% |
| Standard Deviation (Sample) | 5.1% | 3.5% |
| Standard Deviation (Population) | 5.1% | 3.5% |
Similar Demographics by In Labor Force | Age 20-64
Demographics Similar to Immigrants from Poland by In Labor Force | Age 20-64
In terms of in labor force | age 20-64, the demographic groups most similar to Immigrants from Poland are Immigrants from Brazil (80.7%, a difference of 0.030%), Chinese (80.7%, a difference of 0.050%), Paraguayan (80.6%, a difference of 0.070%), Immigrants from Moldova (80.6%, a difference of 0.070%), and Immigrants from Ireland (80.7%, a difference of 0.090%).
| Demographics | Rating | Rank | In Labor Force | Age 20-64 |
| Immigrants | Uganda | 99.9 /100 | #28 | Exceptional 80.7% |
| Immigrants | South Central Asia | 99.9 /100 | #29 | Exceptional 80.7% |
| Immigrants | North Macedonia | 99.9 /100 | #30 | Exceptional 80.7% |
| Immigrants | Lithuania | 99.9 /100 | #31 | Exceptional 80.7% |
| Immigrants | Ireland | 99.9 /100 | #32 | Exceptional 80.7% |
| Chinese | 99.9 /100 | #33 | Exceptional 80.7% |
| Immigrants | Brazil | 99.9 /100 | #34 | Exceptional 80.7% |
| Immigrants | Poland | 99.9 /100 | #35 | Exceptional 80.6% |
| Paraguayans | 99.8 /100 | #36 | Exceptional 80.6% |
| Immigrants | Moldova | 99.8 /100 | #37 | Exceptional 80.6% |
| Ugandans | 99.8 /100 | #38 | Exceptional 80.6% |
| Brazilians | 99.8 /100 | #39 | Exceptional 80.5% |
| Immigrants | Zimbabwe | 99.8 /100 | #40 | Exceptional 80.5% |
| Immigrants | Liberia | 99.8 /100 | #41 | Exceptional 80.5% |
| Latvians | 99.8 /100 | #42 | Exceptional 80.5% |
Demographics Similar to Immigrants from Latin America by In Labor Force | Age 20-64
In terms of in labor force | age 20-64, the demographic groups most similar to Immigrants from Latin America are Marshallese (78.3%, a difference of 0.0%), Scotch-Irish (78.3%, a difference of 0.020%), Immigrants from Barbados (78.3%, a difference of 0.040%), French American Indian (78.2%, a difference of 0.050%), and Aleut (78.2%, a difference of 0.070%).
| Demographics | Rating | Rank | In Labor Force | Age 20-64 |
| Spaniards | 0.1 /100 | #264 | Tragic 78.4% |
| British West Indians | 0.1 /100 | #265 | Tragic 78.4% |
| Bahamians | 0.1 /100 | #266 | Tragic 78.4% |
| U.S. Virgin Islanders | 0.1 /100 | #267 | Tragic 78.4% |
| West Indians | 0.0 /100 | #268 | Tragic 78.3% |
| Immigrants | Barbados | 0.0 /100 | #269 | Tragic 78.3% |
| Scotch-Irish | 0.0 /100 | #270 | Tragic 78.3% |
| Immigrants | Latin America | 0.0 /100 | #271 | Tragic 78.3% |
| Marshallese | 0.0 /100 | #272 | Tragic 78.3% |
| French American Indians | 0.0 /100 | #273 | Tragic 78.2% |
| Aleuts | 0.0 /100 | #274 | Tragic 78.2% |
| Spanish | 0.0 /100 | #275 | Tragic 78.2% |
| Puget Sound Salish | 0.0 /100 | #276 | Tragic 78.2% |
| Immigrants | Bahamas | 0.0 /100 | #277 | Tragic 78.2% |
| Mexican American Indians | 0.0 /100 | #278 | Tragic 78.2% |