Immigrants from Poland vs Immigrants from St. Vincent and the Grenadines In Labor Force | Age 20-64
COMPARE
Immigrants from Poland
Immigrants from St. Vincent and the Grenadines
In Labor Force | Age 20-64
In Labor Force | Age 20-64 Comparison
Immigrants from Poland
Immigrants from St. Vincent and the Grenadines
80.6%
IN LABOR FORCE | AGE 20-64
99.9/ 100
METRIC RATING
35th/ 347
METRIC RANK
78.1%
IN LABOR FORCE | AGE 20-64
0.0/ 100
METRIC RATING
282nd/ 347
METRIC RANK
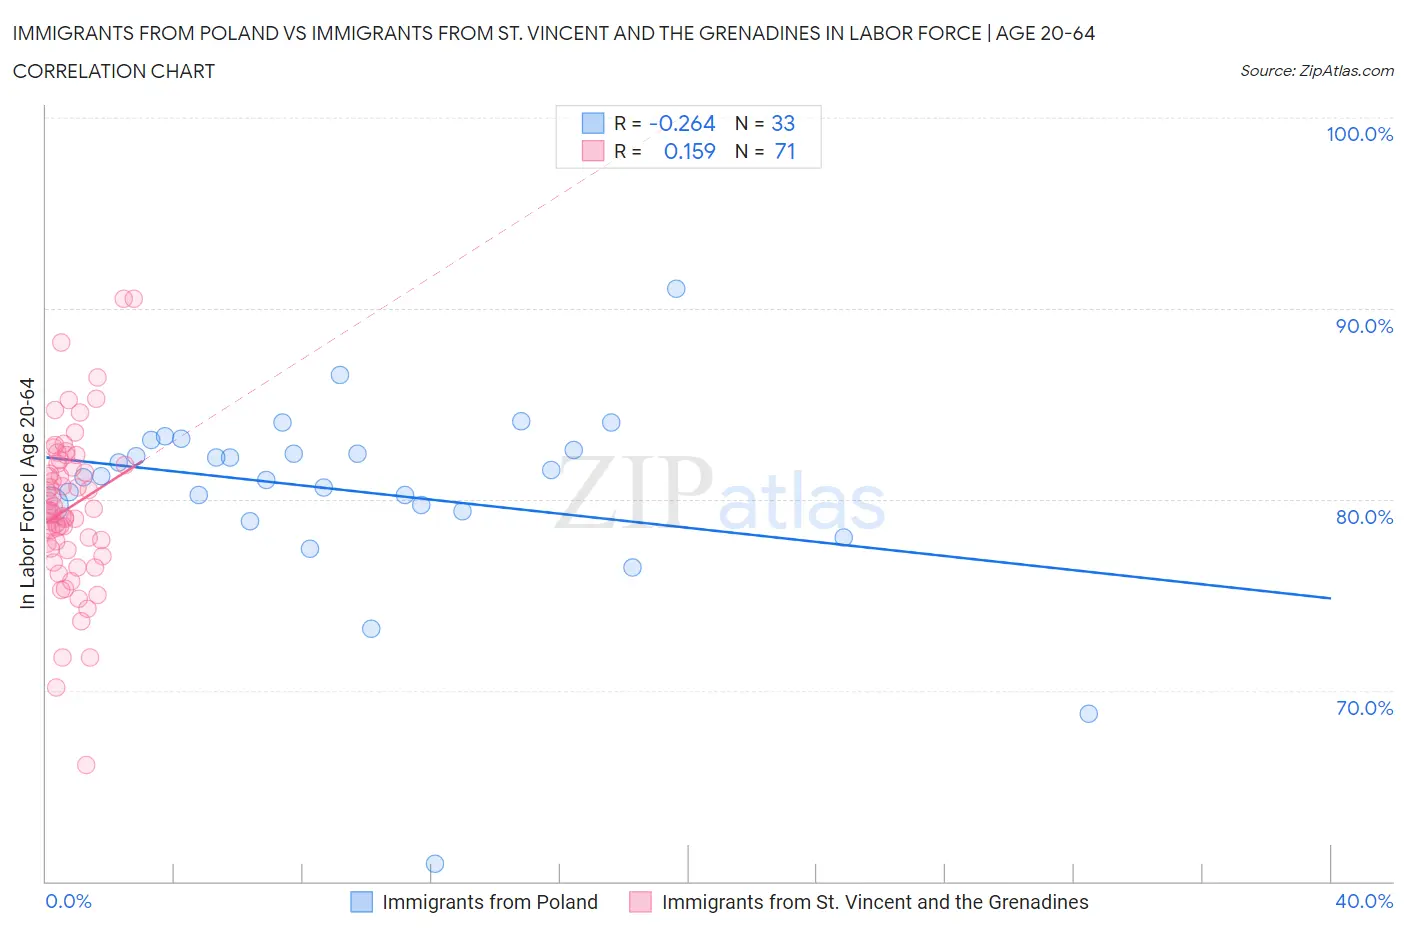
Immigrants from Poland vs Immigrants from St. Vincent and the Grenadines In Labor Force | Age 20-64 Correlation Chart
The statistical analysis conducted on geographies consisting of 304,860,886 people shows a weak negative correlation between the proportion of Immigrants from Poland and labor force participation rate among population between the ages 20 and 64 in the United States with a correlation coefficient (R) of -0.264 and weighted average of 80.6%. Similarly, the statistical analysis conducted on geographies consisting of 56,193,852 people shows a poor positive correlation between the proportion of Immigrants from St. Vincent and the Grenadines and labor force participation rate among population between the ages 20 and 64 in the United States with a correlation coefficient (R) of 0.159 and weighted average of 78.1%, a difference of 3.3%.
In Labor Force | Age 20-64 Correlation Summary
| Measurement | Immigrants from Poland | Immigrants from St. Vincent and the Grenadines |
| Minimum | 60.9% | 66.1% |
| Maximum | 91.0% | 90.5% |
| Range | 30.1% | 24.4% |
| Mean | 80.4% | 79.6% |
| Median | 81.2% | 79.4% |
| Interquartile 25% (IQ1) | 79.5% | 77.4% |
| Interquartile 75% (IQ3) | 82.9% | 81.9% |
| Interquartile Range (IQR) | 3.3% | 4.4% |
| Standard Deviation (Sample) | 5.1% | 4.2% |
| Standard Deviation (Population) | 5.1% | 4.2% |
Similar Demographics by In Labor Force | Age 20-64
Demographics Similar to Immigrants from Poland by In Labor Force | Age 20-64
In terms of in labor force | age 20-64, the demographic groups most similar to Immigrants from Poland are Immigrants from Brazil (80.7%, a difference of 0.030%), Chinese (80.7%, a difference of 0.050%), Paraguayan (80.6%, a difference of 0.070%), Immigrants from Moldova (80.6%, a difference of 0.070%), and Immigrants from Ireland (80.7%, a difference of 0.090%).
| Demographics | Rating | Rank | In Labor Force | Age 20-64 |
| Immigrants | Uganda | 99.9 /100 | #28 | Exceptional 80.7% |
| Immigrants | South Central Asia | 99.9 /100 | #29 | Exceptional 80.7% |
| Immigrants | North Macedonia | 99.9 /100 | #30 | Exceptional 80.7% |
| Immigrants | Lithuania | 99.9 /100 | #31 | Exceptional 80.7% |
| Immigrants | Ireland | 99.9 /100 | #32 | Exceptional 80.7% |
| Chinese | 99.9 /100 | #33 | Exceptional 80.7% |
| Immigrants | Brazil | 99.9 /100 | #34 | Exceptional 80.7% |
| Immigrants | Poland | 99.9 /100 | #35 | Exceptional 80.6% |
| Paraguayans | 99.8 /100 | #36 | Exceptional 80.6% |
| Immigrants | Moldova | 99.8 /100 | #37 | Exceptional 80.6% |
| Ugandans | 99.8 /100 | #38 | Exceptional 80.6% |
| Brazilians | 99.8 /100 | #39 | Exceptional 80.5% |
| Immigrants | Zimbabwe | 99.8 /100 | #40 | Exceptional 80.5% |
| Immigrants | Liberia | 99.8 /100 | #41 | Exceptional 80.5% |
| Latvians | 99.8 /100 | #42 | Exceptional 80.5% |
Demographics Similar to Immigrants from St. Vincent and the Grenadines by In Labor Force | Age 20-64
In terms of in labor force | age 20-64, the demographic groups most similar to Immigrants from St. Vincent and the Grenadines are Nonimmigrants (78.1%, a difference of 0.010%), Guyanese (78.1%, a difference of 0.020%), Immigrants from Guyana (78.1%, a difference of 0.030%), Immigrants from Dominica (78.1%, a difference of 0.050%), and Belizean (78.2%, a difference of 0.090%).
| Demographics | Rating | Rank | In Labor Force | Age 20-64 |
| Spanish | 0.0 /100 | #275 | Tragic 78.2% |
| Puget Sound Salish | 0.0 /100 | #276 | Tragic 78.2% |
| Immigrants | Bahamas | 0.0 /100 | #277 | Tragic 78.2% |
| Mexican American Indians | 0.0 /100 | #278 | Tragic 78.2% |
| Belizeans | 0.0 /100 | #279 | Tragic 78.2% |
| Immigrants | Dominica | 0.0 /100 | #280 | Tragic 78.1% |
| Guyanese | 0.0 /100 | #281 | Tragic 78.1% |
| Immigrants | St. Vincent and the Grenadines | 0.0 /100 | #282 | Tragic 78.1% |
| Immigrants | Nonimmigrants | 0.0 /100 | #283 | Tragic 78.1% |
| Immigrants | Guyana | 0.0 /100 | #284 | Tragic 78.1% |
| Osage | 0.0 /100 | #285 | Tragic 78.0% |
| Immigrants | Belize | 0.0 /100 | #286 | Tragic 78.0% |
| Vietnamese | 0.0 /100 | #287 | Tragic 78.0% |
| Hmong | 0.0 /100 | #288 | Tragic 77.9% |
| Africans | 0.0 /100 | #289 | Tragic 77.9% |