Immigrants from Poland vs Immigrants from Ukraine In Labor Force | Age 20-64
COMPARE
Immigrants from Poland
Immigrants from Ukraine
In Labor Force | Age 20-64
In Labor Force | Age 20-64 Comparison
Immigrants from Poland
Immigrants from Ukraine
80.6%
IN LABOR FORCE | AGE 20-64
99.9/ 100
METRIC RATING
35th/ 347
METRIC RANK
79.9%
IN LABOR FORCE | AGE 20-64
86.5/ 100
METRIC RATING
137th/ 347
METRIC RANK
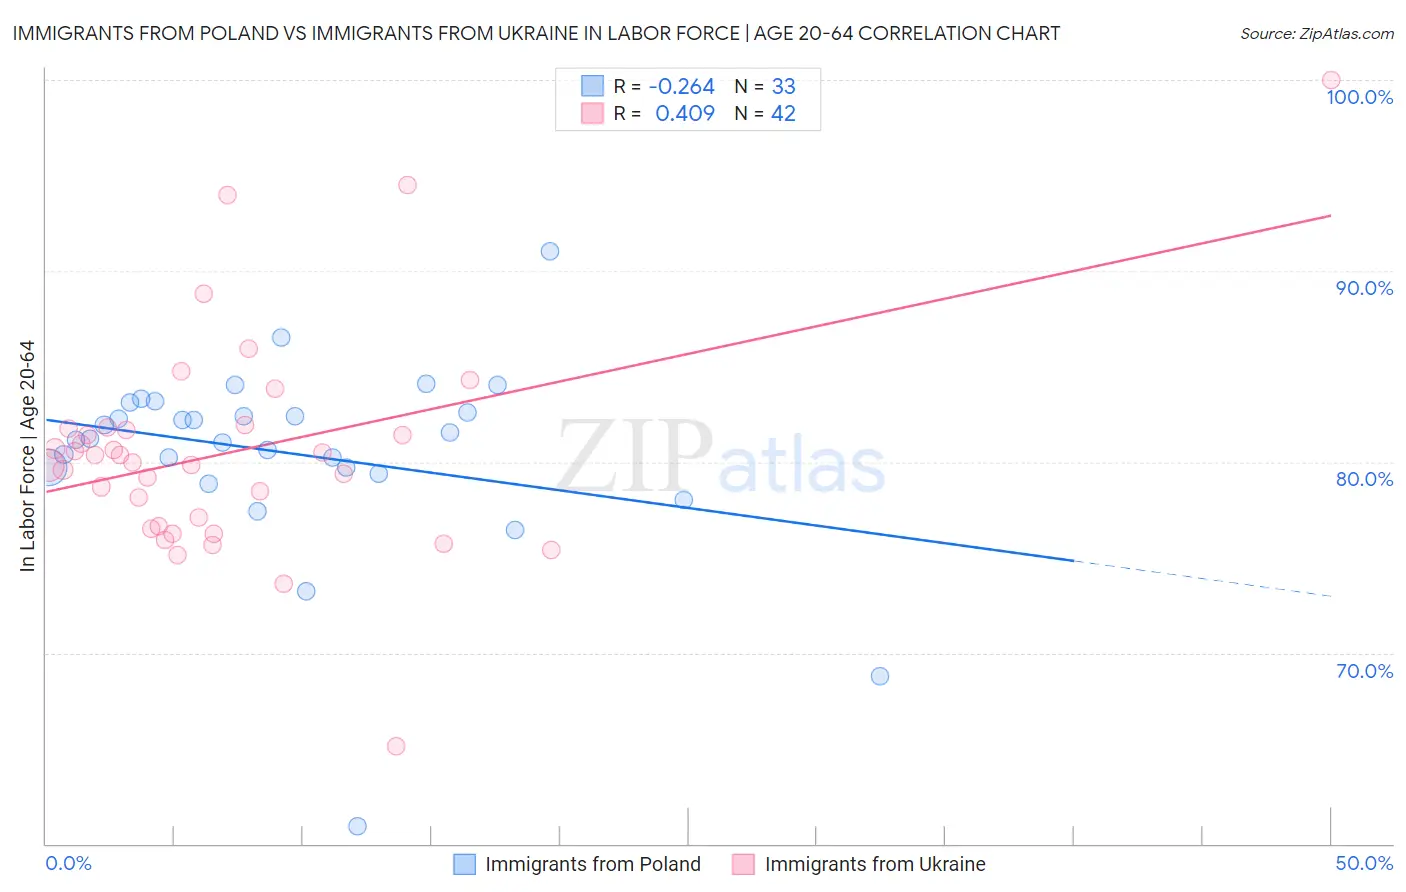
Immigrants from Poland vs Immigrants from Ukraine In Labor Force | Age 20-64 Correlation Chart
The statistical analysis conducted on geographies consisting of 304,860,886 people shows a weak negative correlation between the proportion of Immigrants from Poland and labor force participation rate among population between the ages 20 and 64 in the United States with a correlation coefficient (R) of -0.264 and weighted average of 80.6%. Similarly, the statistical analysis conducted on geographies consisting of 289,706,757 people shows a moderate positive correlation between the proportion of Immigrants from Ukraine and labor force participation rate among population between the ages 20 and 64 in the United States with a correlation coefficient (R) of 0.409 and weighted average of 79.9%, a difference of 0.97%.
In Labor Force | Age 20-64 Correlation Summary
| Measurement | Immigrants from Poland | Immigrants from Ukraine |
| Minimum | 60.9% | 65.1% |
| Maximum | 91.0% | 100.0% |
| Range | 30.1% | 34.9% |
| Mean | 80.4% | 80.5% |
| Median | 81.2% | 80.1% |
| Interquartile 25% (IQ1) | 79.5% | 76.6% |
| Interquartile 75% (IQ3) | 82.9% | 81.8% |
| Interquartile Range (IQR) | 3.3% | 5.1% |
| Standard Deviation (Sample) | 5.1% | 5.9% |
| Standard Deviation (Population) | 5.1% | 5.8% |
Similar Demographics by In Labor Force | Age 20-64
Demographics Similar to Immigrants from Poland by In Labor Force | Age 20-64
In terms of in labor force | age 20-64, the demographic groups most similar to Immigrants from Poland are Immigrants from Brazil (80.7%, a difference of 0.030%), Chinese (80.7%, a difference of 0.050%), Paraguayan (80.6%, a difference of 0.070%), Immigrants from Moldova (80.6%, a difference of 0.070%), and Immigrants from Ireland (80.7%, a difference of 0.090%).
| Demographics | Rating | Rank | In Labor Force | Age 20-64 |
| Immigrants | Uganda | 99.9 /100 | #28 | Exceptional 80.7% |
| Immigrants | South Central Asia | 99.9 /100 | #29 | Exceptional 80.7% |
| Immigrants | North Macedonia | 99.9 /100 | #30 | Exceptional 80.7% |
| Immigrants | Lithuania | 99.9 /100 | #31 | Exceptional 80.7% |
| Immigrants | Ireland | 99.9 /100 | #32 | Exceptional 80.7% |
| Chinese | 99.9 /100 | #33 | Exceptional 80.7% |
| Immigrants | Brazil | 99.9 /100 | #34 | Exceptional 80.7% |
| Immigrants | Poland | 99.9 /100 | #35 | Exceptional 80.6% |
| Paraguayans | 99.8 /100 | #36 | Exceptional 80.6% |
| Immigrants | Moldova | 99.8 /100 | #37 | Exceptional 80.6% |
| Ugandans | 99.8 /100 | #38 | Exceptional 80.6% |
| Brazilians | 99.8 /100 | #39 | Exceptional 80.5% |
| Immigrants | Zimbabwe | 99.8 /100 | #40 | Exceptional 80.5% |
| Immigrants | Liberia | 99.8 /100 | #41 | Exceptional 80.5% |
| Latvians | 99.8 /100 | #42 | Exceptional 80.5% |
Demographics Similar to Immigrants from Ukraine by In Labor Force | Age 20-64
In terms of in labor force | age 20-64, the demographic groups most similar to Immigrants from Ukraine are Immigrants from Singapore (79.9%, a difference of 0.0%), Immigrants from Nigeria (79.9%, a difference of 0.0%), Ukrainian (79.9%, a difference of 0.010%), Indian (Asian) (79.9%, a difference of 0.020%), and South American Indian (79.9%, a difference of 0.020%).
| Demographics | Rating | Rank | In Labor Force | Age 20-64 |
| Immigrants | Zaire | 88.6 /100 | #130 | Excellent 79.9% |
| Immigrants | Iran | 88.3 /100 | #131 | Excellent 79.9% |
| Indians (Asian) | 87.7 /100 | #132 | Excellent 79.9% |
| South American Indians | 87.6 /100 | #133 | Excellent 79.9% |
| Belgians | 87.4 /100 | #134 | Excellent 79.9% |
| Ukrainians | 86.8 /100 | #135 | Excellent 79.9% |
| Immigrants | Singapore | 86.7 /100 | #136 | Excellent 79.9% |
| Immigrants | Ukraine | 86.5 /100 | #137 | Excellent 79.9% |
| Immigrants | Nigeria | 86.4 /100 | #138 | Excellent 79.9% |
| Immigrants | Spain | 83.9 /100 | #139 | Excellent 79.8% |
| Immigrants | South Eastern Asia | 80.4 /100 | #140 | Excellent 79.8% |
| Immigrants | Israel | 80.0 /100 | #141 | Good 79.8% |
| Slovaks | 79.9 /100 | #142 | Good 79.8% |
| Immigrants | Sweden | 79.7 /100 | #143 | Good 79.8% |
| Koreans | 79.6 /100 | #144 | Good 79.8% |