Alaskan Athabascan vs Immigrants from Cabo Verde In Labor Force | Age 20-64
COMPARE
Alaskan Athabascan
Immigrants from Cabo Verde
In Labor Force | Age 20-64
In Labor Force | Age 20-64 Comparison
Alaskan Athabascans
Immigrants from Cabo Verde
76.9%
IN LABOR FORCE | AGE 20-64
0.0/ 100
METRIC RATING
312th/ 347
METRIC RANK
80.3%
IN LABOR FORCE | AGE 20-64
99.0/ 100
METRIC RATING
55th/ 347
METRIC RANK
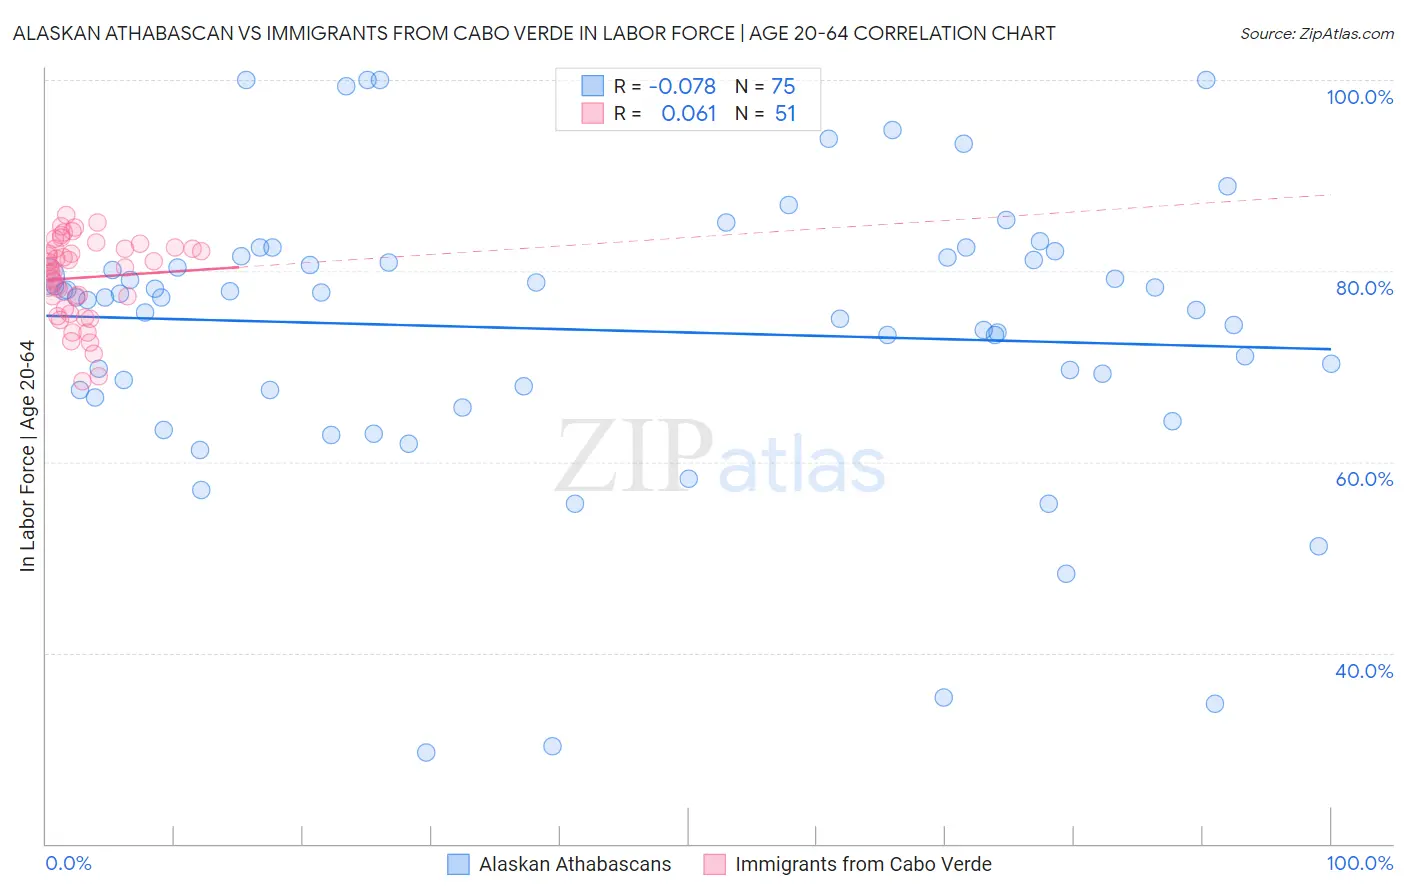
Alaskan Athabascan vs Immigrants from Cabo Verde In Labor Force | Age 20-64 Correlation Chart
The statistical analysis conducted on geographies consisting of 45,821,503 people shows a slight negative correlation between the proportion of Alaskan Athabascans and labor force participation rate among population between the ages 20 and 64 in the United States with a correlation coefficient (R) of -0.078 and weighted average of 76.9%. Similarly, the statistical analysis conducted on geographies consisting of 38,158,316 people shows a slight positive correlation between the proportion of Immigrants from Cabo Verde and labor force participation rate among population between the ages 20 and 64 in the United States with a correlation coefficient (R) of 0.061 and weighted average of 80.3%, a difference of 4.5%.
In Labor Force | Age 20-64 Correlation Summary
| Measurement | Alaskan Athabascan | Immigrants from Cabo Verde |
| Minimum | 29.5% | 68.4% |
| Maximum | 100.0% | 85.9% |
| Range | 70.5% | 17.5% |
| Mean | 73.8% | 79.3% |
| Median | 77.2% | 80.3% |
| Interquartile 25% (IQ1) | 67.5% | 76.0% |
| Interquartile 75% (IQ3) | 81.4% | 82.4% |
| Interquartile Range (IQR) | 13.9% | 6.4% |
| Standard Deviation (Sample) | 15.0% | 4.3% |
| Standard Deviation (Population) | 14.9% | 4.2% |
Similar Demographics by In Labor Force | Age 20-64
Demographics Similar to Alaskan Athabascans by In Labor Force | Age 20-64
In terms of in labor force | age 20-64, the demographic groups most similar to Alaskan Athabascans are Shoshone (76.8%, a difference of 0.12%), Black/African American (76.8%, a difference of 0.14%), Blackfeet (77.0%, a difference of 0.17%), Comanche (77.0%, a difference of 0.21%), and American (77.0%, a difference of 0.22%).
| Demographics | Rating | Rank | In Labor Force | Age 20-64 |
| Mexicans | 0.0 /100 | #305 | Tragic 77.2% |
| Potawatomi | 0.0 /100 | #306 | Tragic 77.2% |
| Central American Indians | 0.0 /100 | #307 | Tragic 77.1% |
| Alaska Natives | 0.0 /100 | #308 | Tragic 77.0% |
| Americans | 0.0 /100 | #309 | Tragic 77.0% |
| Comanche | 0.0 /100 | #310 | Tragic 77.0% |
| Blackfeet | 0.0 /100 | #311 | Tragic 77.0% |
| Alaskan Athabascans | 0.0 /100 | #312 | Tragic 76.9% |
| Shoshone | 0.0 /100 | #313 | Tragic 76.8% |
| Blacks/African Americans | 0.0 /100 | #314 | Tragic 76.8% |
| Ottawa | 0.0 /100 | #315 | Tragic 76.7% |
| Yaqui | 0.0 /100 | #316 | Tragic 76.5% |
| Cherokee | 0.0 /100 | #317 | Tragic 76.2% |
| Chickasaw | 0.0 /100 | #318 | Tragic 76.2% |
| Inupiat | 0.0 /100 | #319 | Tragic 76.1% |
Demographics Similar to Immigrants from Cabo Verde by In Labor Force | Age 20-64
In terms of in labor force | age 20-64, the demographic groups most similar to Immigrants from Cabo Verde are Immigrants from Northern Africa (80.3%, a difference of 0.010%), Afghan (80.3%, a difference of 0.010%), Peruvian (80.3%, a difference of 0.020%), Serbian (80.3%, a difference of 0.030%), and Swedish (80.3%, a difference of 0.030%).
| Demographics | Rating | Rank | In Labor Force | Age 20-64 |
| Immigrants | Hong Kong | 99.5 /100 | #48 | Exceptional 80.4% |
| Immigrants | Greece | 99.4 /100 | #49 | Exceptional 80.4% |
| Immigrants | Sudan | 99.4 /100 | #50 | Exceptional 80.4% |
| Immigrants | Sri Lanka | 99.3 /100 | #51 | Exceptional 80.4% |
| Turks | 99.2 /100 | #52 | Exceptional 80.3% |
| Immigrants | Peru | 99.2 /100 | #53 | Exceptional 80.3% |
| Peruvians | 99.1 /100 | #54 | Exceptional 80.3% |
| Immigrants | Cabo Verde | 99.0 /100 | #55 | Exceptional 80.3% |
| Immigrants | Northern Africa | 99.0 /100 | #56 | Exceptional 80.3% |
| Afghans | 98.9 /100 | #57 | Exceptional 80.3% |
| Serbians | 98.9 /100 | #58 | Exceptional 80.3% |
| Swedes | 98.9 /100 | #59 | Exceptional 80.3% |
| Tongans | 98.8 /100 | #60 | Exceptional 80.3% |
| Burmese | 98.8 /100 | #61 | Exceptional 80.3% |
| Carpatho Rusyns | 98.8 /100 | #62 | Exceptional 80.3% |