Immigrants from Pakistan vs Ute In Labor Force | Age 30-34
COMPARE
Immigrants from Pakistan
Ute
In Labor Force | Age 30-34
In Labor Force | Age 30-34 Comparison
Immigrants from Pakistan
Ute
84.9%
IN LABOR FORCE | AGE 30-34
76.2/ 100
METRIC RATING
148th/ 347
METRIC RANK
78.9%
IN LABOR FORCE | AGE 30-34
0.0/ 100
METRIC RATING
340th/ 347
METRIC RANK
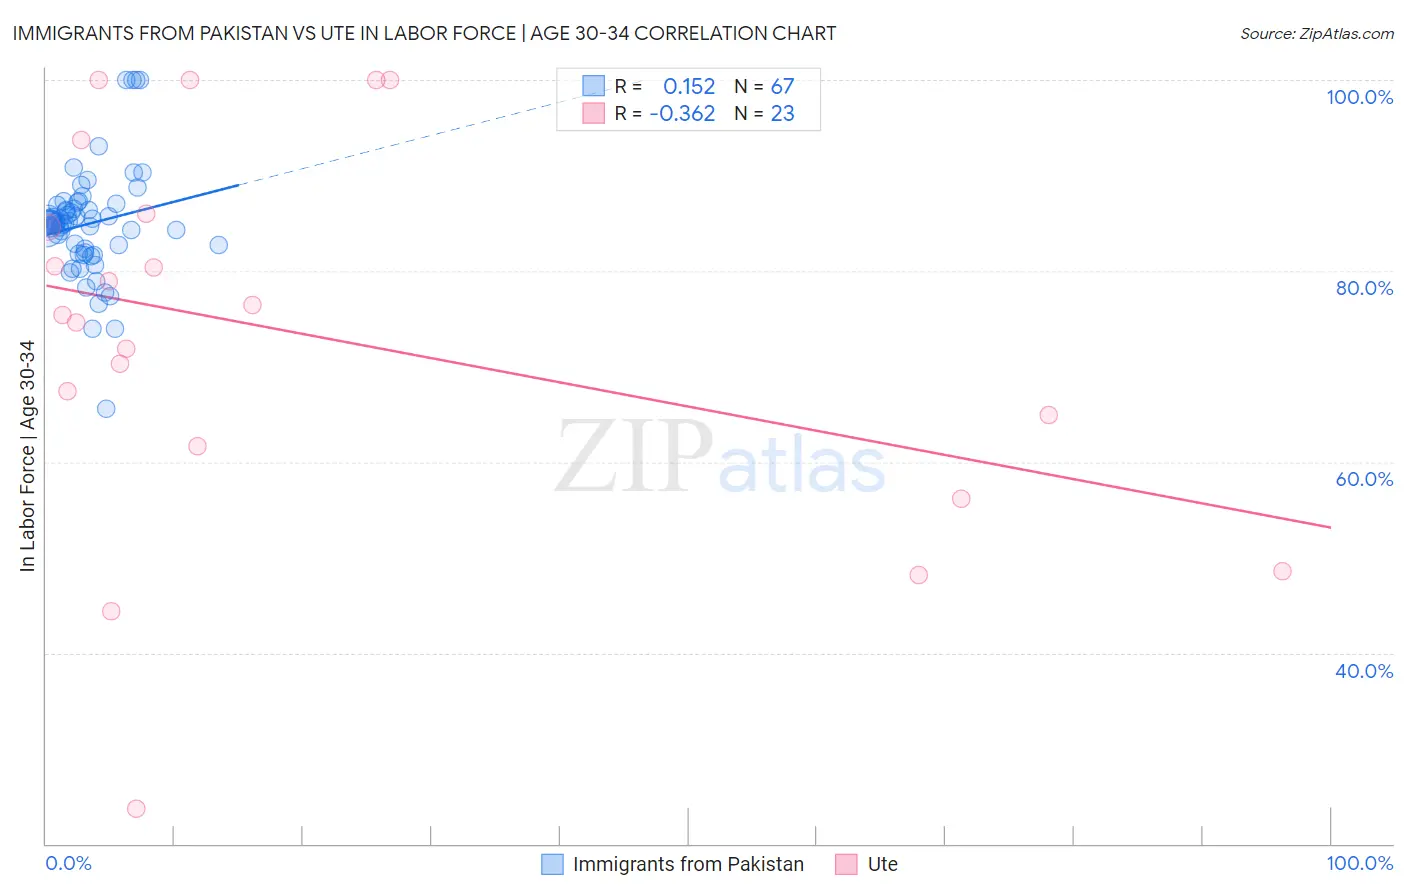
Immigrants from Pakistan vs Ute In Labor Force | Age 30-34 Correlation Chart
The statistical analysis conducted on geographies consisting of 283,823,356 people shows a poor positive correlation between the proportion of Immigrants from Pakistan and labor force participation rate among population between the ages 30 and 34 in the United States with a correlation coefficient (R) of 0.152 and weighted average of 84.9%. Similarly, the statistical analysis conducted on geographies consisting of 55,664,473 people shows a mild negative correlation between the proportion of Ute and labor force participation rate among population between the ages 30 and 34 in the United States with a correlation coefficient (R) of -0.362 and weighted average of 78.9%, a difference of 7.5%.
In Labor Force | Age 30-34 Correlation Summary
| Measurement | Immigrants from Pakistan | Ute |
| Minimum | 65.5% | 23.7% |
| Maximum | 100.0% | 100.0% |
| Range | 34.5% | 76.3% |
| Mean | 84.9% | 73.4% |
| Median | 85.0% | 75.4% |
| Interquartile 25% (IQ1) | 81.9% | 61.7% |
| Interquartile 75% (IQ3) | 86.9% | 86.0% |
| Interquartile Range (IQR) | 5.0% | 24.3% |
| Standard Deviation (Sample) | 5.8% | 20.0% |
| Standard Deviation (Population) | 5.7% | 19.6% |
Similar Demographics by In Labor Force | Age 30-34
Demographics Similar to Immigrants from Pakistan by In Labor Force | Age 30-34
In terms of in labor force | age 30-34, the demographic groups most similar to Immigrants from Pakistan are Immigrants from Saudi Arabia (84.9%, a difference of 0.0%), Immigrants from Colombia (84.9%, a difference of 0.0%), Palestinian (84.9%, a difference of 0.010%), Immigrants from Ukraine (84.8%, a difference of 0.010%), and German (84.8%, a difference of 0.010%).
| Demographics | Rating | Rank | In Labor Force | Age 30-34 |
| Chileans | 85.3 /100 | #141 | Excellent 84.9% |
| Immigrants | Indonesia | 84.3 /100 | #142 | Excellent 84.9% |
| Colombians | 82.2 /100 | #143 | Excellent 84.9% |
| Uruguayans | 78.5 /100 | #144 | Good 84.9% |
| Palestinians | 77.7 /100 | #145 | Good 84.9% |
| Immigrants | Saudi Arabia | 76.6 /100 | #146 | Good 84.9% |
| Immigrants | Colombia | 76.3 /100 | #147 | Good 84.9% |
| Immigrants | Pakistan | 76.2 /100 | #148 | Good 84.9% |
| Immigrants | Ukraine | 75.1 /100 | #149 | Good 84.8% |
| Germans | 75.1 /100 | #150 | Good 84.8% |
| Immigrants | Senegal | 74.0 /100 | #151 | Good 84.8% |
| Romanians | 73.5 /100 | #152 | Good 84.8% |
| Syrians | 70.1 /100 | #153 | Good 84.8% |
| Northern Europeans | 70.0 /100 | #154 | Good 84.8% |
| Immigrants | Sudan | 69.5 /100 | #155 | Good 84.8% |
Demographics Similar to Ute by In Labor Force | Age 30-34
In terms of in labor force | age 30-34, the demographic groups most similar to Ute are Apache (79.0%, a difference of 0.10%), Pima (79.0%, a difference of 0.13%), Yakama (79.1%, a difference of 0.25%), Native/Alaskan (79.2%, a difference of 0.29%), and Marshallese (79.2%, a difference of 0.37%).
| Demographics | Rating | Rank | In Labor Force | Age 30-34 |
| Inupiat | 0.0 /100 | #333 | Tragic 79.7% |
| Hopi | 0.0 /100 | #334 | Tragic 79.3% |
| Marshallese | 0.0 /100 | #335 | Tragic 79.2% |
| Natives/Alaskans | 0.0 /100 | #336 | Tragic 79.2% |
| Yakama | 0.0 /100 | #337 | Tragic 79.1% |
| Pima | 0.0 /100 | #338 | Tragic 79.0% |
| Apache | 0.0 /100 | #339 | Tragic 79.0% |
| Ute | 0.0 /100 | #340 | Tragic 78.9% |
| Immigrants | Yemen | 0.0 /100 | #341 | Tragic 78.2% |
| Tohono O'odham | 0.0 /100 | #342 | Tragic 77.7% |
| Lumbee | 0.0 /100 | #343 | Tragic 77.3% |
| Yuman | 0.0 /100 | #344 | Tragic 77.1% |
| Yup'ik | 0.0 /100 | #345 | Tragic 76.4% |
| Crow | 0.0 /100 | #346 | Tragic 75.9% |
| Navajo | 0.0 /100 | #347 | Tragic 73.8% |