Immigrants from Africa vs Ute In Labor Force | Age 30-34
COMPARE
Immigrants from Africa
Ute
In Labor Force | Age 30-34
In Labor Force | Age 30-34 Comparison
Immigrants from Africa
Ute
85.3%
IN LABOR FORCE | AGE 30-34
98.6/ 100
METRIC RATING
82nd/ 347
METRIC RANK
78.9%
IN LABOR FORCE | AGE 30-34
0.0/ 100
METRIC RATING
340th/ 347
METRIC RANK
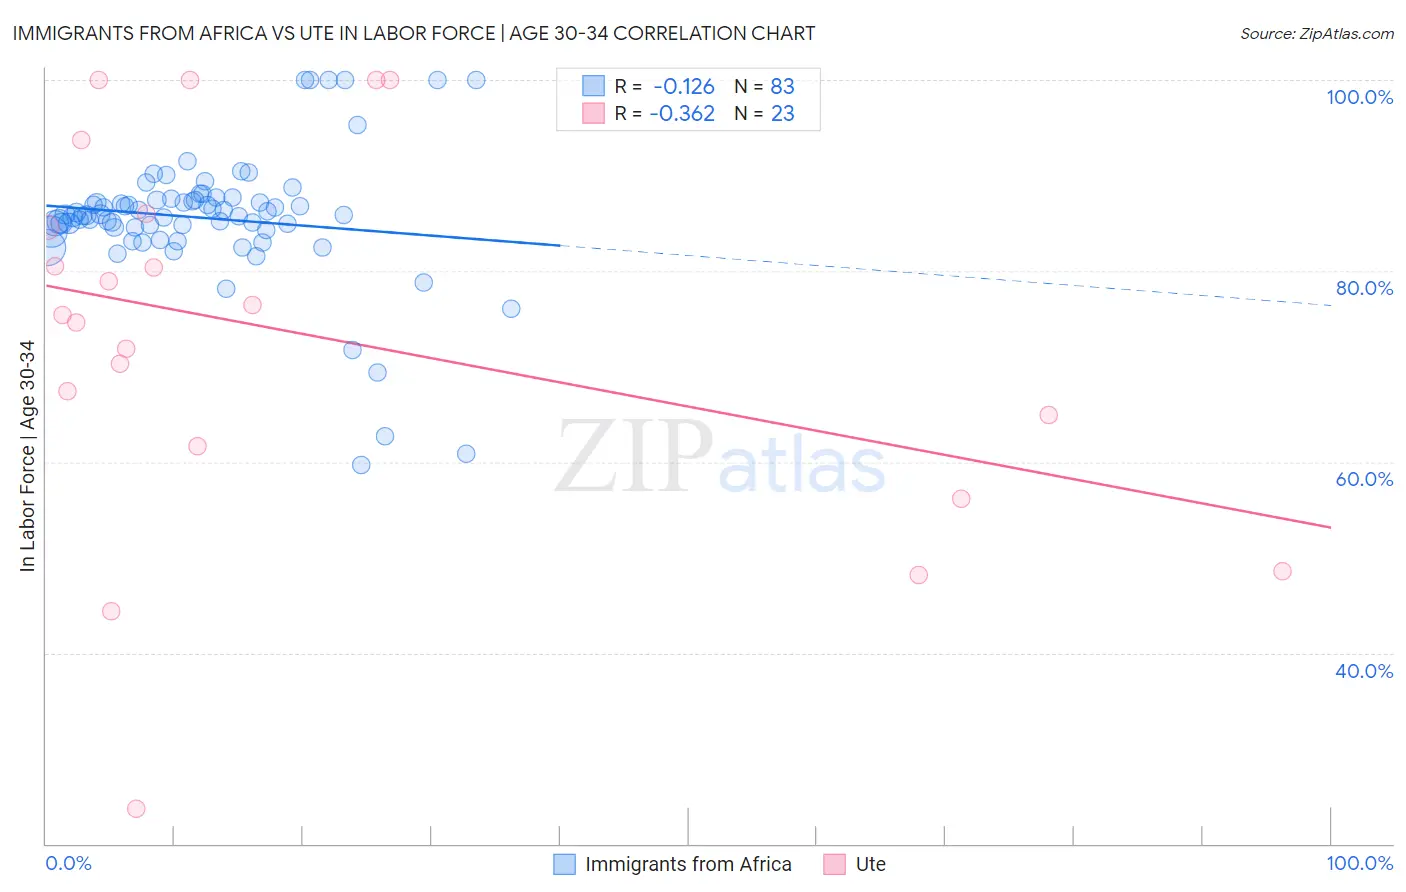
Immigrants from Africa vs Ute In Labor Force | Age 30-34 Correlation Chart
The statistical analysis conducted on geographies consisting of 469,010,548 people shows a poor negative correlation between the proportion of Immigrants from Africa and labor force participation rate among population between the ages 30 and 34 in the United States with a correlation coefficient (R) of -0.126 and weighted average of 85.3%. Similarly, the statistical analysis conducted on geographies consisting of 55,664,473 people shows a mild negative correlation between the proportion of Ute and labor force participation rate among population between the ages 30 and 34 in the United States with a correlation coefficient (R) of -0.362 and weighted average of 78.9%, a difference of 8.1%.
In Labor Force | Age 30-34 Correlation Summary
| Measurement | Immigrants from Africa | Ute |
| Minimum | 59.7% | 23.7% |
| Maximum | 100.0% | 100.0% |
| Range | 40.3% | 76.3% |
| Mean | 85.5% | 73.4% |
| Median | 85.8% | 75.4% |
| Interquartile 25% (IQ1) | 84.3% | 61.7% |
| Interquartile 75% (IQ3) | 87.5% | 86.0% |
| Interquartile Range (IQR) | 3.2% | 24.3% |
| Standard Deviation (Sample) | 7.1% | 20.0% |
| Standard Deviation (Population) | 7.1% | 19.6% |
Similar Demographics by In Labor Force | Age 30-34
Demographics Similar to Immigrants from Africa by In Labor Force | Age 30-34
In terms of in labor force | age 30-34, the demographic groups most similar to Immigrants from Africa are Immigrants from Switzerland (85.3%, a difference of 0.010%), Immigrants from Russia (85.3%, a difference of 0.010%), Slovak (85.3%, a difference of 0.010%), Immigrants from Europe (85.3%, a difference of 0.010%), and Greek (85.3%, a difference of 0.010%).
| Demographics | Rating | Rank | In Labor Force | Age 30-34 |
| Immigrants | Czechoslovakia | 99.0 /100 | #75 | Exceptional 85.4% |
| Iranians | 99.0 /100 | #76 | Exceptional 85.4% |
| Immigrants | Eastern Asia | 98.9 /100 | #77 | Exceptional 85.4% |
| Immigrants | Singapore | 98.8 /100 | #78 | Exceptional 85.3% |
| Immigrants | Switzerland | 98.7 /100 | #79 | Exceptional 85.3% |
| Immigrants | Russia | 98.7 /100 | #80 | Exceptional 85.3% |
| Slovaks | 98.7 /100 | #81 | Exceptional 85.3% |
| Immigrants | Africa | 98.6 /100 | #82 | Exceptional 85.3% |
| Immigrants | Europe | 98.6 /100 | #83 | Exceptional 85.3% |
| Greeks | 98.6 /100 | #84 | Exceptional 85.3% |
| Mongolians | 98.5 /100 | #85 | Exceptional 85.3% |
| Immigrants | Taiwan | 98.3 /100 | #86 | Exceptional 85.3% |
| Immigrants | Northern Europe | 98.2 /100 | #87 | Exceptional 85.3% |
| Immigrants | Belgium | 98.2 /100 | #88 | Exceptional 85.3% |
| Immigrants | Kazakhstan | 98.1 /100 | #89 | Exceptional 85.3% |
Demographics Similar to Ute by In Labor Force | Age 30-34
In terms of in labor force | age 30-34, the demographic groups most similar to Ute are Apache (79.0%, a difference of 0.10%), Pima (79.0%, a difference of 0.13%), Yakama (79.1%, a difference of 0.25%), Native/Alaskan (79.2%, a difference of 0.29%), and Marshallese (79.2%, a difference of 0.37%).
| Demographics | Rating | Rank | In Labor Force | Age 30-34 |
| Inupiat | 0.0 /100 | #333 | Tragic 79.7% |
| Hopi | 0.0 /100 | #334 | Tragic 79.3% |
| Marshallese | 0.0 /100 | #335 | Tragic 79.2% |
| Natives/Alaskans | 0.0 /100 | #336 | Tragic 79.2% |
| Yakama | 0.0 /100 | #337 | Tragic 79.1% |
| Pima | 0.0 /100 | #338 | Tragic 79.0% |
| Apache | 0.0 /100 | #339 | Tragic 79.0% |
| Ute | 0.0 /100 | #340 | Tragic 78.9% |
| Immigrants | Yemen | 0.0 /100 | #341 | Tragic 78.2% |
| Tohono O'odham | 0.0 /100 | #342 | Tragic 77.7% |
| Lumbee | 0.0 /100 | #343 | Tragic 77.3% |
| Yuman | 0.0 /100 | #344 | Tragic 77.1% |
| Yup'ik | 0.0 /100 | #345 | Tragic 76.4% |
| Crow | 0.0 /100 | #346 | Tragic 75.9% |
| Navajo | 0.0 /100 | #347 | Tragic 73.8% |