Immigrants from Pakistan vs White/Caucasian In Labor Force | Age 30-34
COMPARE
Immigrants from Pakistan
White/Caucasian
In Labor Force | Age 30-34
In Labor Force | Age 30-34 Comparison
Immigrants from Pakistan
Whites/Caucasians
84.9%
IN LABOR FORCE | AGE 30-34
76.2/ 100
METRIC RATING
148th/ 347
METRIC RANK
83.9%
IN LABOR FORCE | AGE 30-34
0.5/ 100
METRIC RATING
255th/ 347
METRIC RANK
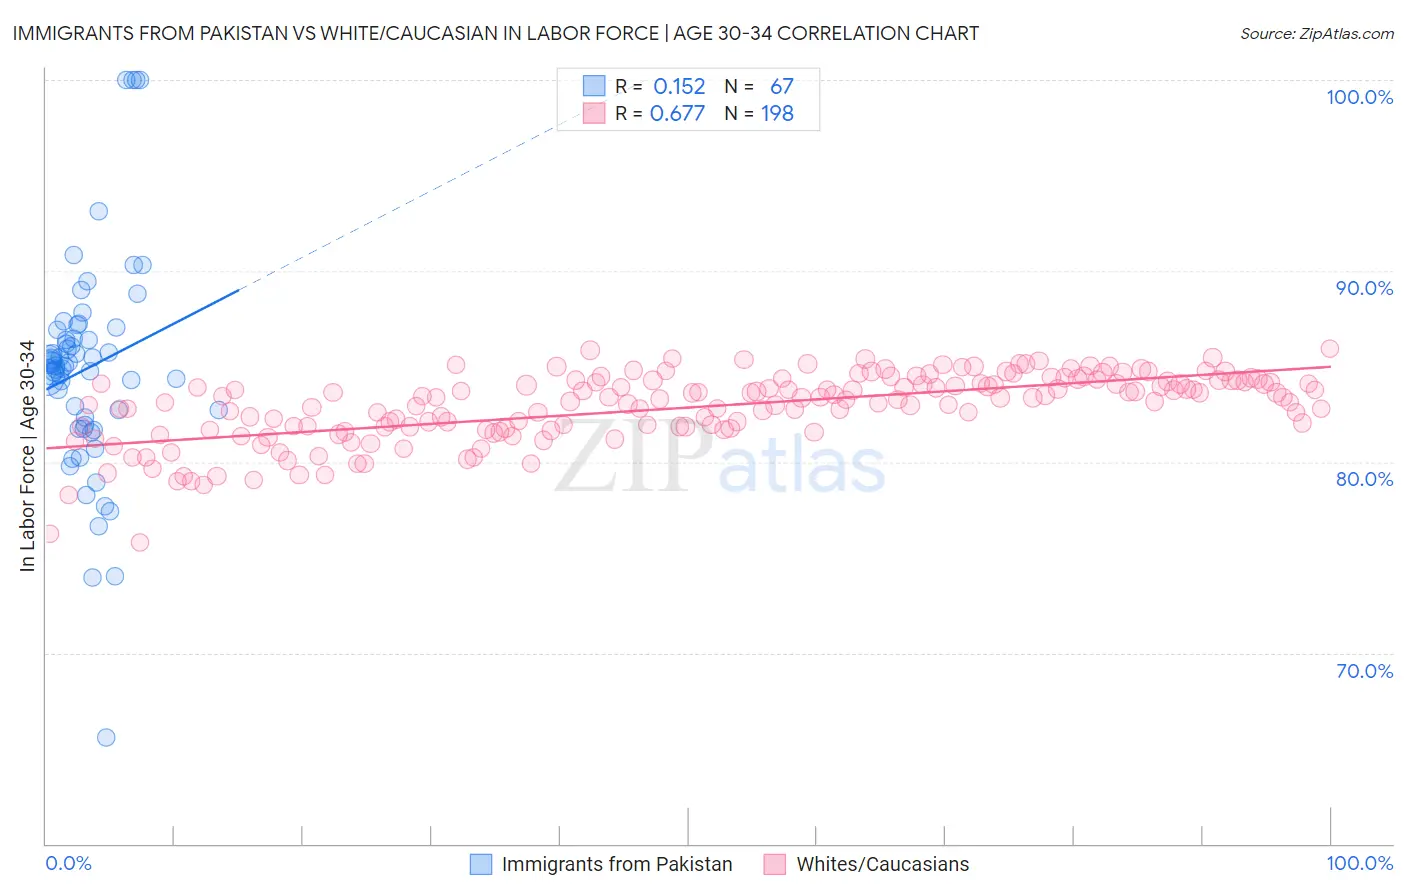
Immigrants from Pakistan vs White/Caucasian In Labor Force | Age 30-34 Correlation Chart
The statistical analysis conducted on geographies consisting of 283,823,356 people shows a poor positive correlation between the proportion of Immigrants from Pakistan and labor force participation rate among population between the ages 30 and 34 in the United States with a correlation coefficient (R) of 0.152 and weighted average of 84.9%. Similarly, the statistical analysis conducted on geographies consisting of 582,394,774 people shows a significant positive correlation between the proportion of Whites/Caucasians and labor force participation rate among population between the ages 30 and 34 in the United States with a correlation coefficient (R) of 0.677 and weighted average of 83.9%, a difference of 1.1%.
In Labor Force | Age 30-34 Correlation Summary
| Measurement | Immigrants from Pakistan | White/Caucasian |
| Minimum | 65.5% | 75.8% |
| Maximum | 100.0% | 85.9% |
| Range | 34.5% | 10.2% |
| Mean | 84.9% | 82.9% |
| Median | 85.0% | 83.4% |
| Interquartile 25% (IQ1) | 81.9% | 81.8% |
| Interquartile 75% (IQ3) | 86.9% | 84.2% |
| Interquartile Range (IQR) | 5.0% | 2.4% |
| Standard Deviation (Sample) | 5.8% | 1.8% |
| Standard Deviation (Population) | 5.7% | 1.8% |
Similar Demographics by In Labor Force | Age 30-34
Demographics Similar to Immigrants from Pakistan by In Labor Force | Age 30-34
In terms of in labor force | age 30-34, the demographic groups most similar to Immigrants from Pakistan are Immigrants from Saudi Arabia (84.9%, a difference of 0.0%), Immigrants from Colombia (84.9%, a difference of 0.0%), Palestinian (84.9%, a difference of 0.010%), Immigrants from Ukraine (84.8%, a difference of 0.010%), and German (84.8%, a difference of 0.010%).
| Demographics | Rating | Rank | In Labor Force | Age 30-34 |
| Chileans | 85.3 /100 | #141 | Excellent 84.9% |
| Immigrants | Indonesia | 84.3 /100 | #142 | Excellent 84.9% |
| Colombians | 82.2 /100 | #143 | Excellent 84.9% |
| Uruguayans | 78.5 /100 | #144 | Good 84.9% |
| Palestinians | 77.7 /100 | #145 | Good 84.9% |
| Immigrants | Saudi Arabia | 76.6 /100 | #146 | Good 84.9% |
| Immigrants | Colombia | 76.3 /100 | #147 | Good 84.9% |
| Immigrants | Pakistan | 76.2 /100 | #148 | Good 84.9% |
| Immigrants | Ukraine | 75.1 /100 | #149 | Good 84.8% |
| Germans | 75.1 /100 | #150 | Good 84.8% |
| Immigrants | Senegal | 74.0 /100 | #151 | Good 84.8% |
| Romanians | 73.5 /100 | #152 | Good 84.8% |
| Syrians | 70.1 /100 | #153 | Good 84.8% |
| Northern Europeans | 70.0 /100 | #154 | Good 84.8% |
| Immigrants | Sudan | 69.5 /100 | #155 | Good 84.8% |
Demographics Similar to Whites/Caucasians by In Labor Force | Age 30-34
In terms of in labor force | age 30-34, the demographic groups most similar to Whites/Caucasians are Immigrants from St. Vincent and the Grenadines (83.9%, a difference of 0.020%), Nicaraguan (83.9%, a difference of 0.040%), Bahamian (83.9%, a difference of 0.040%), Immigrants from Nicaragua (83.9%, a difference of 0.040%), and Immigrants from Lebanon (83.9%, a difference of 0.040%).
| Demographics | Rating | Rank | In Labor Force | Age 30-34 |
| Portuguese | 0.8 /100 | #248 | Tragic 84.0% |
| Immigrants | Dominica | 0.7 /100 | #249 | Tragic 84.0% |
| Immigrants | Iraq | 0.7 /100 | #250 | Tragic 83.9% |
| Nicaraguans | 0.6 /100 | #251 | Tragic 83.9% |
| Bahamians | 0.6 /100 | #252 | Tragic 83.9% |
| Immigrants | Nicaragua | 0.6 /100 | #253 | Tragic 83.9% |
| Immigrants | St. Vincent and the Grenadines | 0.5 /100 | #254 | Tragic 83.9% |
| Whites/Caucasians | 0.5 /100 | #255 | Tragic 83.9% |
| Immigrants | Lebanon | 0.4 /100 | #256 | Tragic 83.9% |
| Iraqis | 0.3 /100 | #257 | Tragic 83.8% |
| Hondurans | 0.3 /100 | #258 | Tragic 83.8% |
| Scotch-Irish | 0.3 /100 | #259 | Tragic 83.8% |
| Immigrants | Dominican Republic | 0.3 /100 | #260 | Tragic 83.8% |
| Guyanese | 0.3 /100 | #261 | Tragic 83.8% |
| Dominicans | 0.2 /100 | #262 | Tragic 83.8% |