Afghan vs Ute In Labor Force | Age 30-34
COMPARE
Afghan
Ute
In Labor Force | Age 30-34
In Labor Force | Age 30-34 Comparison
Afghans
Ute
84.7%
IN LABOR FORCE | AGE 30-34
55.2/ 100
METRIC RATING
166th/ 347
METRIC RANK
78.9%
IN LABOR FORCE | AGE 30-34
0.0/ 100
METRIC RATING
340th/ 347
METRIC RANK
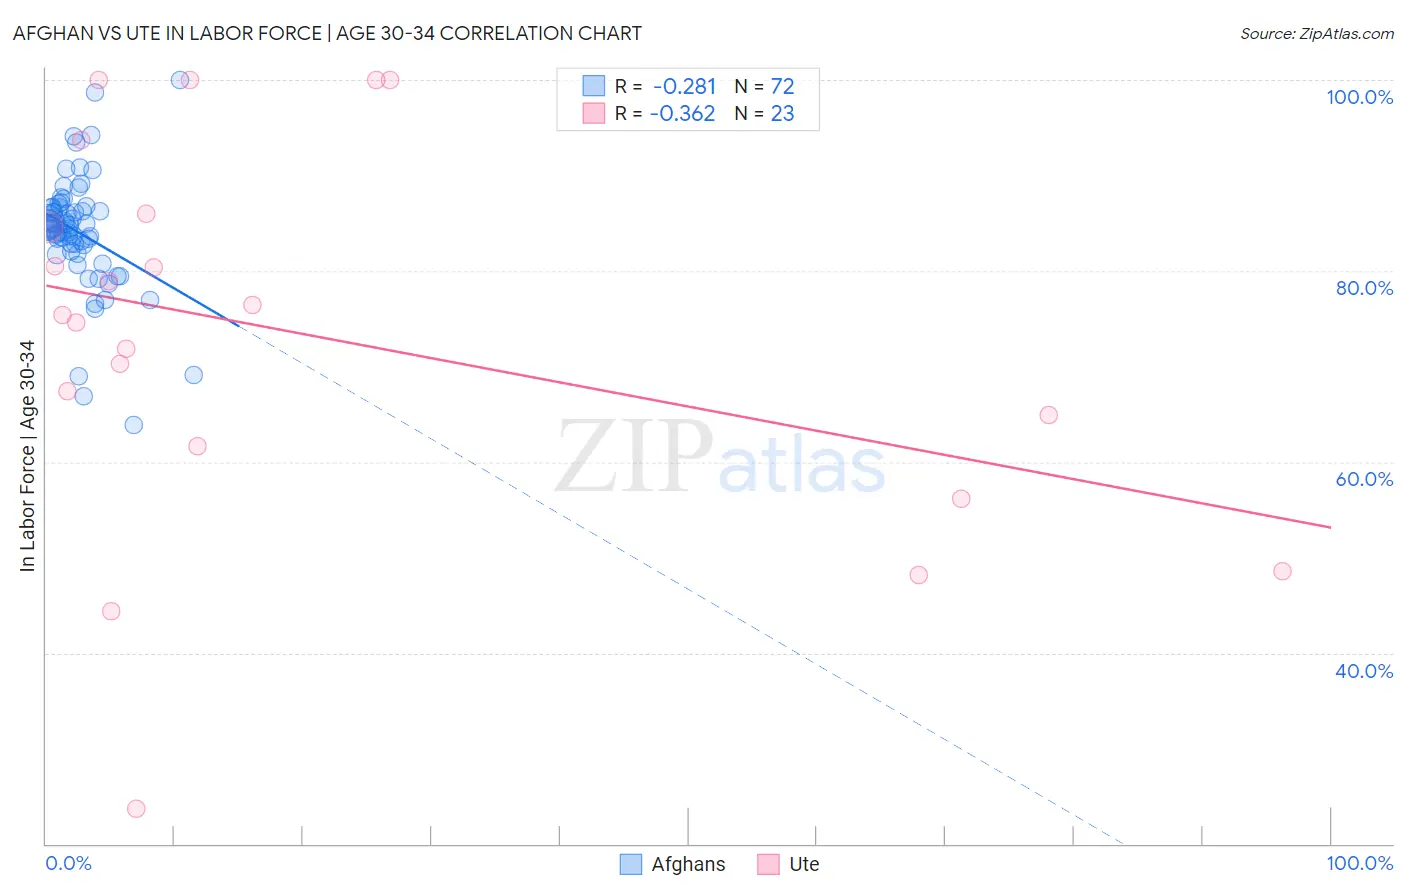
Afghan vs Ute In Labor Force | Age 30-34 Correlation Chart
The statistical analysis conducted on geographies consisting of 148,857,099 people shows a weak negative correlation between the proportion of Afghans and labor force participation rate among population between the ages 30 and 34 in the United States with a correlation coefficient (R) of -0.281 and weighted average of 84.7%. Similarly, the statistical analysis conducted on geographies consisting of 55,664,473 people shows a mild negative correlation between the proportion of Ute and labor force participation rate among population between the ages 30 and 34 in the United States with a correlation coefficient (R) of -0.362 and weighted average of 78.9%, a difference of 7.3%.
In Labor Force | Age 30-34 Correlation Summary
| Measurement | Afghan | Ute |
| Minimum | 63.9% | 23.7% |
| Maximum | 100.0% | 100.0% |
| Range | 36.1% | 76.3% |
| Mean | 84.1% | 73.4% |
| Median | 84.5% | 75.4% |
| Interquartile 25% (IQ1) | 82.4% | 61.7% |
| Interquartile 75% (IQ3) | 86.6% | 86.0% |
| Interquartile Range (IQR) | 4.2% | 24.3% |
| Standard Deviation (Sample) | 6.1% | 20.0% |
| Standard Deviation (Population) | 6.0% | 19.6% |
Similar Demographics by In Labor Force | Age 30-34
Demographics Similar to Afghans by In Labor Force | Age 30-34
In terms of in labor force | age 30-34, the demographic groups most similar to Afghans are Icelander (84.7%, a difference of 0.010%), Immigrants from Western Europe (84.7%, a difference of 0.010%), Immigrants from South Eastern Asia (84.7%, a difference of 0.010%), South American (84.7%, a difference of 0.020%), and Immigrants from Uruguay (84.7%, a difference of 0.020%).
| Demographics | Rating | Rank | In Labor Force | Age 30-34 |
| Czechoslovakians | 63.0 /100 | #159 | Good 84.8% |
| Pakistanis | 60.8 /100 | #160 | Good 84.7% |
| Immigrants | Cambodia | 60.7 /100 | #161 | Good 84.7% |
| South Americans | 58.7 /100 | #162 | Average 84.7% |
| Immigrants | Uruguay | 57.4 /100 | #163 | Average 84.7% |
| Icelanders | 56.8 /100 | #164 | Average 84.7% |
| Immigrants | Western Europe | 56.7 /100 | #165 | Average 84.7% |
| Afghans | 55.2 /100 | #166 | Average 84.7% |
| Immigrants | South Eastern Asia | 54.2 /100 | #167 | Average 84.7% |
| Immigrants | Peru | 52.4 /100 | #168 | Average 84.7% |
| South American Indians | 52.1 /100 | #169 | Average 84.7% |
| Immigrants | Burma/Myanmar | 52.0 /100 | #170 | Average 84.7% |
| Irish | 52.0 /100 | #171 | Average 84.7% |
| Immigrants | England | 51.7 /100 | #172 | Average 84.7% |
| Israelis | 51.1 /100 | #173 | Average 84.7% |
Demographics Similar to Ute by In Labor Force | Age 30-34
In terms of in labor force | age 30-34, the demographic groups most similar to Ute are Apache (79.0%, a difference of 0.10%), Pima (79.0%, a difference of 0.13%), Yakama (79.1%, a difference of 0.25%), Native/Alaskan (79.2%, a difference of 0.29%), and Marshallese (79.2%, a difference of 0.37%).
| Demographics | Rating | Rank | In Labor Force | Age 30-34 |
| Inupiat | 0.0 /100 | #333 | Tragic 79.7% |
| Hopi | 0.0 /100 | #334 | Tragic 79.3% |
| Marshallese | 0.0 /100 | #335 | Tragic 79.2% |
| Natives/Alaskans | 0.0 /100 | #336 | Tragic 79.2% |
| Yakama | 0.0 /100 | #337 | Tragic 79.1% |
| Pima | 0.0 /100 | #338 | Tragic 79.0% |
| Apache | 0.0 /100 | #339 | Tragic 79.0% |
| Ute | 0.0 /100 | #340 | Tragic 78.9% |
| Immigrants | Yemen | 0.0 /100 | #341 | Tragic 78.2% |
| Tohono O'odham | 0.0 /100 | #342 | Tragic 77.7% |
| Lumbee | 0.0 /100 | #343 | Tragic 77.3% |
| Yuman | 0.0 /100 | #344 | Tragic 77.1% |
| Yup'ik | 0.0 /100 | #345 | Tragic 76.4% |
| Crow | 0.0 /100 | #346 | Tragic 75.9% |
| Navajo | 0.0 /100 | #347 | Tragic 73.8% |