Immigrants from Pakistan vs Spanish American In Labor Force | Age 30-34
COMPARE
Immigrants from Pakistan
Spanish American
In Labor Force | Age 30-34
In Labor Force | Age 30-34 Comparison
Immigrants from Pakistan
Spanish Americans
84.9%
IN LABOR FORCE | AGE 30-34
76.2/ 100
METRIC RATING
148th/ 347
METRIC RANK
83.5%
IN LABOR FORCE | AGE 30-34
0.0/ 100
METRIC RATING
270th/ 347
METRIC RANK
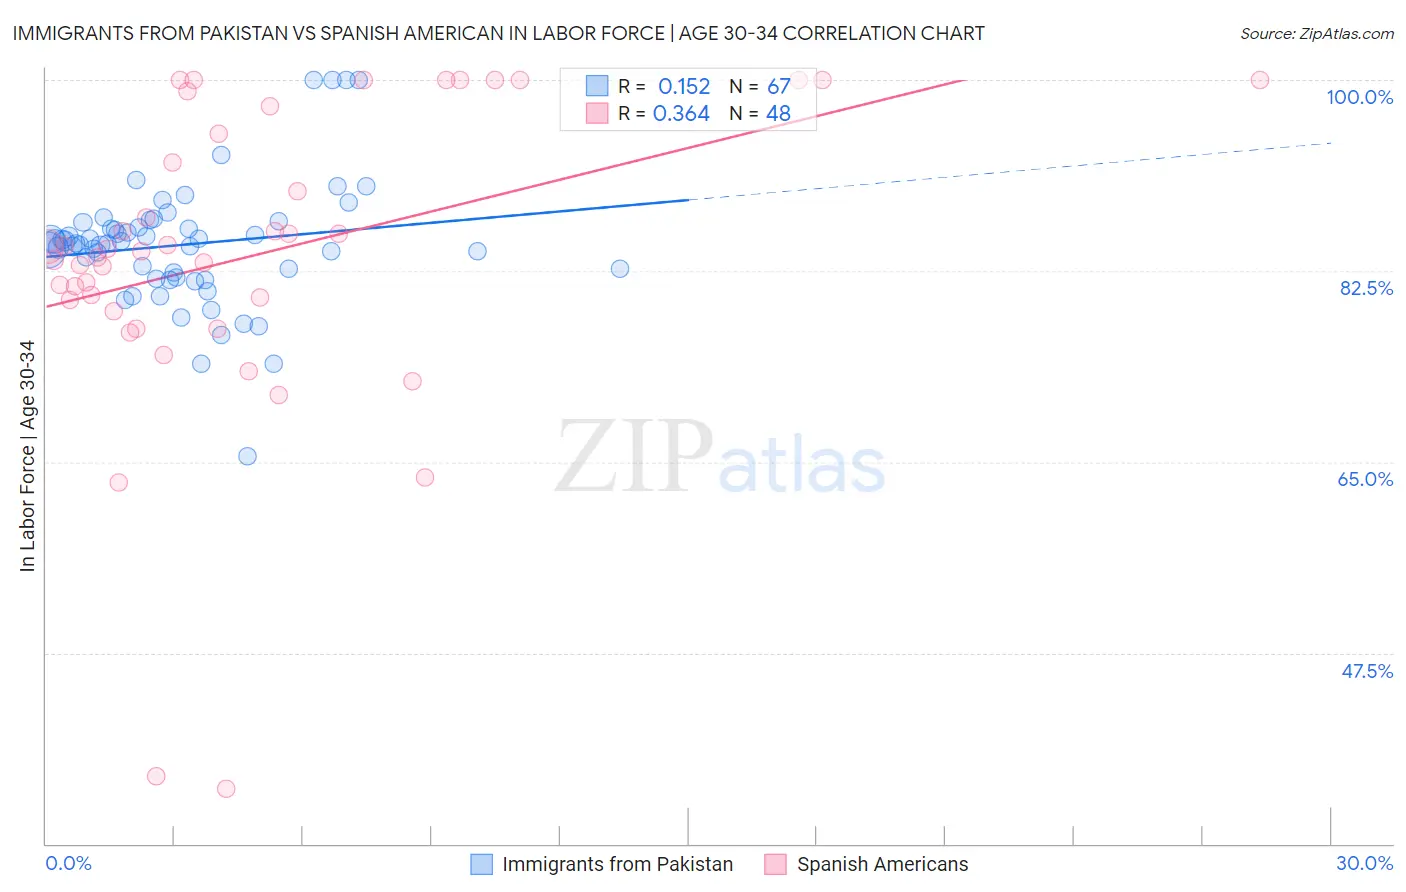
Immigrants from Pakistan vs Spanish American In Labor Force | Age 30-34 Correlation Chart
The statistical analysis conducted on geographies consisting of 283,823,356 people shows a poor positive correlation between the proportion of Immigrants from Pakistan and labor force participation rate among population between the ages 30 and 34 in the United States with a correlation coefficient (R) of 0.152 and weighted average of 84.9%. Similarly, the statistical analysis conducted on geographies consisting of 103,148,754 people shows a mild positive correlation between the proportion of Spanish Americans and labor force participation rate among population between the ages 30 and 34 in the United States with a correlation coefficient (R) of 0.364 and weighted average of 83.5%, a difference of 1.6%.
In Labor Force | Age 30-34 Correlation Summary
| Measurement | Immigrants from Pakistan | Spanish American |
| Minimum | 65.5% | 35.0% |
| Maximum | 100.0% | 100.0% |
| Range | 34.5% | 65.0% |
| Mean | 84.9% | 83.9% |
| Median | 85.0% | 84.4% |
| Interquartile 25% (IQ1) | 81.9% | 79.3% |
| Interquartile 75% (IQ3) | 86.9% | 96.3% |
| Interquartile Range (IQR) | 5.0% | 17.1% |
| Standard Deviation (Sample) | 5.8% | 14.2% |
| Standard Deviation (Population) | 5.7% | 14.1% |
Similar Demographics by In Labor Force | Age 30-34
Demographics Similar to Immigrants from Pakistan by In Labor Force | Age 30-34
In terms of in labor force | age 30-34, the demographic groups most similar to Immigrants from Pakistan are Immigrants from Saudi Arabia (84.9%, a difference of 0.0%), Immigrants from Colombia (84.9%, a difference of 0.0%), Palestinian (84.9%, a difference of 0.010%), Immigrants from Ukraine (84.8%, a difference of 0.010%), and German (84.8%, a difference of 0.010%).
| Demographics | Rating | Rank | In Labor Force | Age 30-34 |
| Chileans | 85.3 /100 | #141 | Excellent 84.9% |
| Immigrants | Indonesia | 84.3 /100 | #142 | Excellent 84.9% |
| Colombians | 82.2 /100 | #143 | Excellent 84.9% |
| Uruguayans | 78.5 /100 | #144 | Good 84.9% |
| Palestinians | 77.7 /100 | #145 | Good 84.9% |
| Immigrants | Saudi Arabia | 76.6 /100 | #146 | Good 84.9% |
| Immigrants | Colombia | 76.3 /100 | #147 | Good 84.9% |
| Immigrants | Pakistan | 76.2 /100 | #148 | Good 84.9% |
| Immigrants | Ukraine | 75.1 /100 | #149 | Good 84.8% |
| Germans | 75.1 /100 | #150 | Good 84.8% |
| Immigrants | Senegal | 74.0 /100 | #151 | Good 84.8% |
| Romanians | 73.5 /100 | #152 | Good 84.8% |
| Syrians | 70.1 /100 | #153 | Good 84.8% |
| Northern Europeans | 70.0 /100 | #154 | Good 84.8% |
| Immigrants | Sudan | 69.5 /100 | #155 | Good 84.8% |
Demographics Similar to Spanish Americans by In Labor Force | Age 30-34
In terms of in labor force | age 30-34, the demographic groups most similar to Spanish Americans are Spanish (83.5%, a difference of 0.020%), Nonimmigrants (83.5%, a difference of 0.020%), Vietnamese (83.6%, a difference of 0.050%), Immigrants from Bangladesh (83.6%, a difference of 0.060%), and Spaniard (83.6%, a difference of 0.070%).
| Demographics | Rating | Rank | In Labor Force | Age 30-34 |
| Immigrants | Guyana | 0.2 /100 | #263 | Tragic 83.8% |
| Guatemalans | 0.2 /100 | #264 | Tragic 83.7% |
| Immigrants | Honduras | 0.1 /100 | #265 | Tragic 83.7% |
| Immigrants | Guatemala | 0.1 /100 | #266 | Tragic 83.7% |
| Spaniards | 0.1 /100 | #267 | Tragic 83.6% |
| Immigrants | Bangladesh | 0.1 /100 | #268 | Tragic 83.6% |
| Vietnamese | 0.1 /100 | #269 | Tragic 83.6% |
| Spanish Americans | 0.0 /100 | #270 | Tragic 83.5% |
| Spanish | 0.0 /100 | #271 | Tragic 83.5% |
| Immigrants | Nonimmigrants | 0.0 /100 | #272 | Tragic 83.5% |
| Guamanians/Chamorros | 0.0 /100 | #273 | Tragic 83.5% |
| Belizeans | 0.0 /100 | #274 | Tragic 83.5% |
| Immigrants | Grenada | 0.0 /100 | #275 | Tragic 83.5% |
| Tongans | 0.0 /100 | #276 | Tragic 83.5% |
| Delaware | 0.0 /100 | #277 | Tragic 83.5% |