British West Indian vs Immigrants from Malaysia In Labor Force | Age 30-34
COMPARE
British West Indian
Immigrants from Malaysia
In Labor Force | Age 30-34
In Labor Force | Age 30-34 Comparison
British West Indians
Immigrants from Malaysia
84.0%
IN LABOR FORCE | AGE 30-34
0.8/ 100
METRIC RATING
247th/ 347
METRIC RANK
85.1%
IN LABOR FORCE | AGE 30-34
94.2/ 100
METRIC RATING
118th/ 347
METRIC RANK
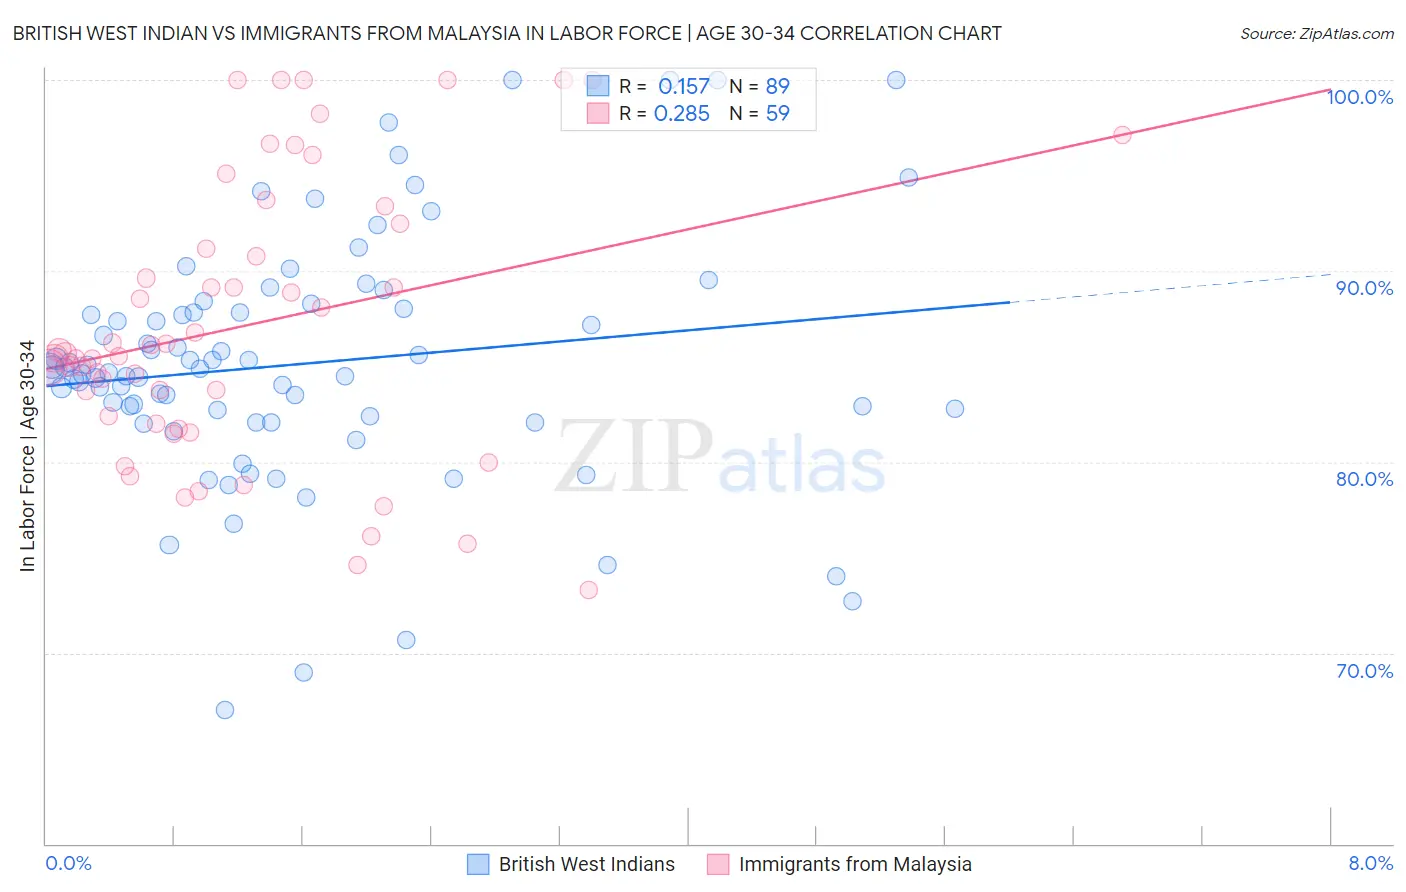
British West Indian vs Immigrants from Malaysia In Labor Force | Age 30-34 Correlation Chart
The statistical analysis conducted on geographies consisting of 152,639,615 people shows a poor positive correlation between the proportion of British West Indians and labor force participation rate among population between the ages 30 and 34 in the United States with a correlation coefficient (R) of 0.157 and weighted average of 84.0%. Similarly, the statistical analysis conducted on geographies consisting of 197,947,649 people shows a weak positive correlation between the proportion of Immigrants from Malaysia and labor force participation rate among population between the ages 30 and 34 in the United States with a correlation coefficient (R) of 0.285 and weighted average of 85.1%, a difference of 1.3%.
In Labor Force | Age 30-34 Correlation Summary
| Measurement | British West Indian | Immigrants from Malaysia |
| Minimum | 67.0% | 73.3% |
| Maximum | 100.0% | 100.0% |
| Range | 33.0% | 26.7% |
| Mean | 85.1% | 87.2% |
| Median | 84.9% | 85.7% |
| Interquartile 25% (IQ1) | 82.2% | 82.0% |
| Interquartile 75% (IQ3) | 87.9% | 92.5% |
| Interquartile Range (IQR) | 5.7% | 10.5% |
| Standard Deviation (Sample) | 6.4% | 7.2% |
| Standard Deviation (Population) | 6.4% | 7.1% |
Similar Demographics by In Labor Force | Age 30-34
Demographics Similar to British West Indians by In Labor Force | Age 30-34
In terms of in labor force | age 30-34, the demographic groups most similar to British West Indians are Portuguese (84.0%, a difference of 0.010%), Basque (84.0%, a difference of 0.020%), Immigrants from Venezuela (84.0%, a difference of 0.020%), Central American (84.0%, a difference of 0.020%), and Immigrants from Dominica (84.0%, a difference of 0.020%).
| Demographics | Rating | Rank | In Labor Force | Age 30-34 |
| Venezuelans | 1.3 /100 | #240 | Tragic 84.0% |
| Immigrants | Portugal | 1.2 /100 | #241 | Tragic 84.0% |
| Immigrants | Oceania | 1.1 /100 | #242 | Tragic 84.0% |
| Immigrants | Caribbean | 1.1 /100 | #243 | Tragic 84.0% |
| Basques | 0.9 /100 | #244 | Tragic 84.0% |
| Immigrants | Venezuela | 0.9 /100 | #245 | Tragic 84.0% |
| Central Americans | 0.9 /100 | #246 | Tragic 84.0% |
| British West Indians | 0.8 /100 | #247 | Tragic 84.0% |
| Portuguese | 0.8 /100 | #248 | Tragic 84.0% |
| Immigrants | Dominica | 0.7 /100 | #249 | Tragic 84.0% |
| Immigrants | Iraq | 0.7 /100 | #250 | Tragic 83.9% |
| Nicaraguans | 0.6 /100 | #251 | Tragic 83.9% |
| Bahamians | 0.6 /100 | #252 | Tragic 83.9% |
| Immigrants | Nicaragua | 0.6 /100 | #253 | Tragic 83.9% |
| Immigrants | St. Vincent and the Grenadines | 0.5 /100 | #254 | Tragic 83.9% |
Demographics Similar to Immigrants from Malaysia by In Labor Force | Age 30-34
In terms of in labor force | age 30-34, the demographic groups most similar to Immigrants from Malaysia are Immigrants from Denmark (85.1%, a difference of 0.0%), Immigrants from Romania (85.1%, a difference of 0.010%), Yugoslavian (85.1%, a difference of 0.010%), Immigrants from South Central Asia (85.1%, a difference of 0.010%), and Egyptian (85.1%, a difference of 0.010%).
| Demographics | Rating | Rank | In Labor Force | Age 30-34 |
| Immigrants | Scotland | 94.9 /100 | #111 | Exceptional 85.1% |
| Immigrants | Hungary | 94.8 /100 | #112 | Exceptional 85.1% |
| Immigrants | Romania | 94.7 /100 | #113 | Exceptional 85.1% |
| Yugoslavians | 94.7 /100 | #114 | Exceptional 85.1% |
| Immigrants | South Central Asia | 94.6 /100 | #115 | Exceptional 85.1% |
| Egyptians | 94.5 /100 | #116 | Exceptional 85.1% |
| Immigrants | Denmark | 94.3 /100 | #117 | Exceptional 85.1% |
| Immigrants | Malaysia | 94.2 /100 | #118 | Exceptional 85.1% |
| Asians | 93.4 /100 | #119 | Exceptional 85.1% |
| Immigrants | Southern Europe | 93.3 /100 | #120 | Exceptional 85.1% |
| Immigrants | Egypt | 93.2 /100 | #121 | Exceptional 85.1% |
| Immigrants | Kuwait | 92.6 /100 | #122 | Exceptional 85.1% |
| Armenians | 92.2 /100 | #123 | Exceptional 85.0% |
| Australians | 92.0 /100 | #124 | Exceptional 85.0% |
| Immigrants | Jordan | 91.5 /100 | #125 | Exceptional 85.0% |