Macedonian vs Immigrants from Malaysia In Labor Force | Age 30-34
COMPARE
Macedonian
Immigrants from Malaysia
In Labor Force | Age 30-34
In Labor Force | Age 30-34 Comparison
Macedonians
Immigrants from Malaysia
85.5%
IN LABOR FORCE | AGE 30-34
99.4/ 100
METRIC RATING
63rd/ 347
METRIC RANK
85.1%
IN LABOR FORCE | AGE 30-34
94.2/ 100
METRIC RATING
118th/ 347
METRIC RANK
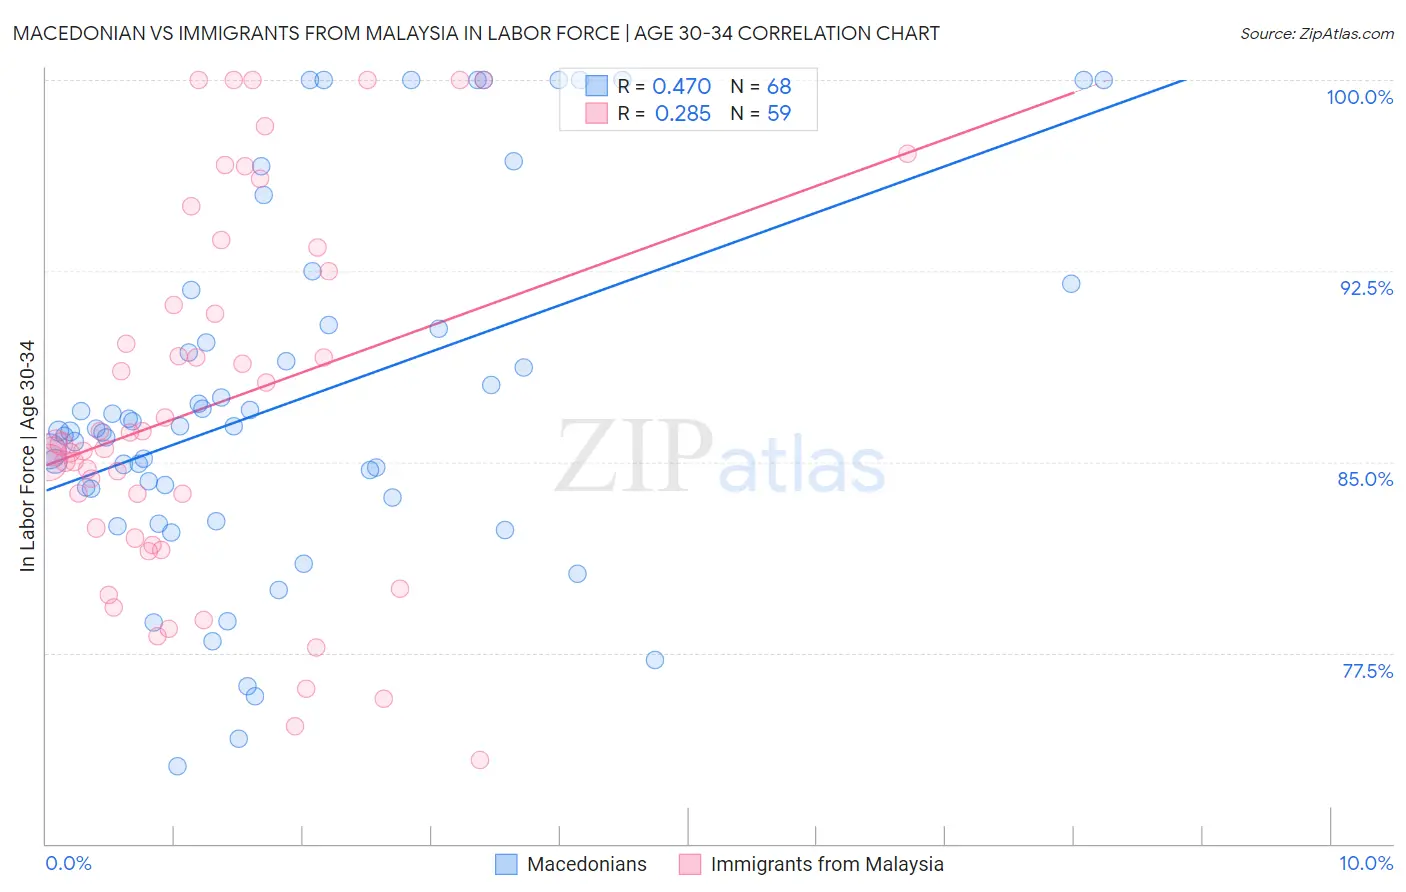
Macedonian vs Immigrants from Malaysia In Labor Force | Age 30-34 Correlation Chart
The statistical analysis conducted on geographies consisting of 132,641,832 people shows a moderate positive correlation between the proportion of Macedonians and labor force participation rate among population between the ages 30 and 34 in the United States with a correlation coefficient (R) of 0.470 and weighted average of 85.5%. Similarly, the statistical analysis conducted on geographies consisting of 197,947,649 people shows a weak positive correlation between the proportion of Immigrants from Malaysia and labor force participation rate among population between the ages 30 and 34 in the United States with a correlation coefficient (R) of 0.285 and weighted average of 85.1%, a difference of 0.42%.
In Labor Force | Age 30-34 Correlation Summary
| Measurement | Macedonian | Immigrants from Malaysia |
| Minimum | 73.0% | 73.3% |
| Maximum | 100.0% | 100.0% |
| Range | 27.0% | 26.7% |
| Mean | 87.4% | 87.2% |
| Median | 86.3% | 85.7% |
| Interquartile 25% (IQ1) | 83.8% | 82.0% |
| Interquartile 75% (IQ3) | 90.3% | 92.5% |
| Interquartile Range (IQR) | 6.5% | 10.5% |
| Standard Deviation (Sample) | 7.0% | 7.2% |
| Standard Deviation (Population) | 7.0% | 7.1% |
Similar Demographics by In Labor Force | Age 30-34
Demographics Similar to Macedonians by In Labor Force | Age 30-34
In terms of in labor force | age 30-34, the demographic groups most similar to Macedonians are Soviet Union (85.5%, a difference of 0.0%), Immigrants from France (85.5%, a difference of 0.010%), Immigrants from Brazil (85.5%, a difference of 0.010%), Italian (85.4%, a difference of 0.010%), and Senegalese (85.4%, a difference of 0.010%).
| Demographics | Rating | Rank | In Labor Force | Age 30-34 |
| Czechs | 99.6 /100 | #56 | Exceptional 85.5% |
| Russians | 99.6 /100 | #57 | Exceptional 85.5% |
| Poles | 99.6 /100 | #58 | Exceptional 85.5% |
| Immigrants | Poland | 99.5 /100 | #59 | Exceptional 85.5% |
| Immigrants | France | 99.5 /100 | #60 | Exceptional 85.5% |
| Immigrants | Brazil | 99.5 /100 | #61 | Exceptional 85.5% |
| Soviet Union | 99.4 /100 | #62 | Exceptional 85.5% |
| Macedonians | 99.4 /100 | #63 | Exceptional 85.5% |
| Italians | 99.4 /100 | #64 | Exceptional 85.4% |
| Senegalese | 99.4 /100 | #65 | Exceptional 85.4% |
| Ghanaians | 99.4 /100 | #66 | Exceptional 85.4% |
| Kenyans | 99.3 /100 | #67 | Exceptional 85.4% |
| Immigrants | Eastern Europe | 99.3 /100 | #68 | Exceptional 85.4% |
| Immigrants | Iran | 99.2 /100 | #69 | Exceptional 85.4% |
| Brazilians | 99.1 /100 | #70 | Exceptional 85.4% |
Demographics Similar to Immigrants from Malaysia by In Labor Force | Age 30-34
In terms of in labor force | age 30-34, the demographic groups most similar to Immigrants from Malaysia are Immigrants from Denmark (85.1%, a difference of 0.0%), Immigrants from Romania (85.1%, a difference of 0.010%), Yugoslavian (85.1%, a difference of 0.010%), Immigrants from South Central Asia (85.1%, a difference of 0.010%), and Egyptian (85.1%, a difference of 0.010%).
| Demographics | Rating | Rank | In Labor Force | Age 30-34 |
| Immigrants | Scotland | 94.9 /100 | #111 | Exceptional 85.1% |
| Immigrants | Hungary | 94.8 /100 | #112 | Exceptional 85.1% |
| Immigrants | Romania | 94.7 /100 | #113 | Exceptional 85.1% |
| Yugoslavians | 94.7 /100 | #114 | Exceptional 85.1% |
| Immigrants | South Central Asia | 94.6 /100 | #115 | Exceptional 85.1% |
| Egyptians | 94.5 /100 | #116 | Exceptional 85.1% |
| Immigrants | Denmark | 94.3 /100 | #117 | Exceptional 85.1% |
| Immigrants | Malaysia | 94.2 /100 | #118 | Exceptional 85.1% |
| Asians | 93.4 /100 | #119 | Exceptional 85.1% |
| Immigrants | Southern Europe | 93.3 /100 | #120 | Exceptional 85.1% |
| Immigrants | Egypt | 93.2 /100 | #121 | Exceptional 85.1% |
| Immigrants | Kuwait | 92.6 /100 | #122 | Exceptional 85.1% |
| Armenians | 92.2 /100 | #123 | Exceptional 85.0% |
| Australians | 92.0 /100 | #124 | Exceptional 85.0% |
| Immigrants | Jordan | 91.5 /100 | #125 | Exceptional 85.0% |