Immigrants from Norway vs Immigrants from Ethiopia In Labor Force | Age 16-19
COMPARE
Immigrants from Norway
Immigrants from Ethiopia
In Labor Force | Age 16-19
In Labor Force | Age 16-19 Comparison
Immigrants from Norway
Immigrants from Ethiopia
35.9%
IN LABOR FORCE | AGE 16-19
19.8/ 100
METRIC RATING
199th/ 347
METRIC RANK
38.6%
IN LABOR FORCE | AGE 16-19
98.7/ 100
METRIC RATING
108th/ 347
METRIC RANK
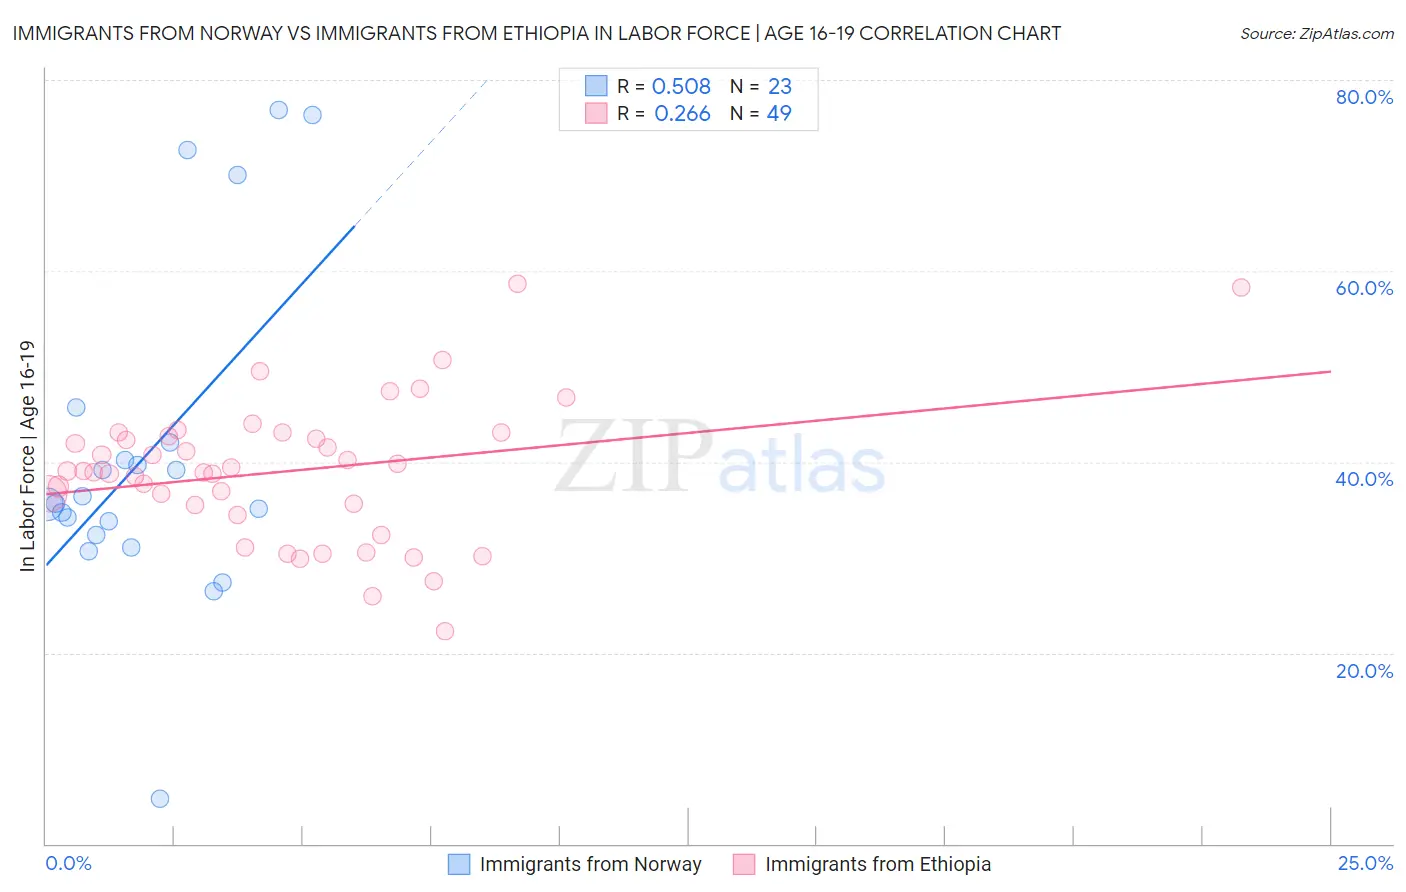
Immigrants from Norway vs Immigrants from Ethiopia In Labor Force | Age 16-19 Correlation Chart
The statistical analysis conducted on geographies consisting of 116,617,950 people shows a substantial positive correlation between the proportion of Immigrants from Norway and labor force participation rate among population between the ages 16 and 19 in the United States with a correlation coefficient (R) of 0.508 and weighted average of 35.9%. Similarly, the statistical analysis conducted on geographies consisting of 211,509,636 people shows a weak positive correlation between the proportion of Immigrants from Ethiopia and labor force participation rate among population between the ages 16 and 19 in the United States with a correlation coefficient (R) of 0.266 and weighted average of 38.6%, a difference of 7.3%.
In Labor Force | Age 16-19 Correlation Summary
| Measurement | Immigrants from Norway | Immigrants from Ethiopia |
| Minimum | 4.7% | 22.2% |
| Maximum | 76.9% | 58.7% |
| Range | 72.2% | 36.5% |
| Mean | 40.9% | 39.0% |
| Median | 35.6% | 39.1% |
| Interquartile 25% (IQ1) | 32.4% | 35.0% |
| Interquartile 75% (IQ3) | 42.0% | 42.8% |
| Interquartile Range (IQR) | 9.6% | 7.9% |
| Standard Deviation (Sample) | 17.4% | 7.3% |
| Standard Deviation (Population) | 17.0% | 7.3% |
Similar Demographics by In Labor Force | Age 16-19
Demographics Similar to Immigrants from Norway by In Labor Force | Age 16-19
In terms of in labor force | age 16-19, the demographic groups most similar to Immigrants from Norway are Immigrants from Northern Africa (35.9%, a difference of 0.010%), Immigrants from Sweden (35.9%, a difference of 0.080%), Immigrants from Serbia (36.0%, a difference of 0.090%), Mexican American Indian (36.0%, a difference of 0.10%), and Alsatian (35.9%, a difference of 0.19%).
| Demographics | Rating | Rank | In Labor Force | Age 16-19 |
| Afghans | 25.7 /100 | #192 | Fair 36.1% |
| Immigrants | Denmark | 25.0 /100 | #193 | Fair 36.1% |
| Nigerians | 24.6 /100 | #194 | Fair 36.1% |
| Bolivians | 23.3 /100 | #195 | Fair 36.0% |
| Mexican American Indians | 21.1 /100 | #196 | Fair 36.0% |
| Immigrants | Serbia | 21.0 /100 | #197 | Fair 36.0% |
| Immigrants | Northern Africa | 19.9 /100 | #198 | Poor 35.9% |
| Immigrants | Norway | 19.8 /100 | #199 | Poor 35.9% |
| Immigrants | Sweden | 18.8 /100 | #200 | Poor 35.9% |
| Alsatians | 17.5 /100 | #201 | Poor 35.9% |
| Senegalese | 17.4 /100 | #202 | Poor 35.9% |
| Immigrants | Nigeria | 16.8 /100 | #203 | Poor 35.8% |
| Immigrants | Albania | 15.0 /100 | #204 | Poor 35.8% |
| South American Indians | 14.6 /100 | #205 | Poor 35.8% |
| Chileans | 14.6 /100 | #206 | Poor 35.8% |
Demographics Similar to Immigrants from Ethiopia by In Labor Force | Age 16-19
In terms of in labor force | age 16-19, the demographic groups most similar to Immigrants from Ethiopia are Lebanese (38.6%, a difference of 0.0%), Chinese (38.6%, a difference of 0.10%), Maltese (38.5%, a difference of 0.12%), Delaware (38.6%, a difference of 0.13%), and Iraqi (38.6%, a difference of 0.15%).
| Demographics | Rating | Rank | In Labor Force | Age 16-19 |
| Hmong | 99.1 /100 | #101 | Exceptional 38.7% |
| Zimbabweans | 99.1 /100 | #102 | Exceptional 38.7% |
| Immigrants | Cameroon | 99.0 /100 | #103 | Exceptional 38.7% |
| Immigrants | Eritrea | 99.0 /100 | #104 | Exceptional 38.7% |
| Iraqis | 98.9 /100 | #105 | Exceptional 38.6% |
| Delaware | 98.8 /100 | #106 | Exceptional 38.6% |
| Chinese | 98.8 /100 | #107 | Exceptional 38.6% |
| Immigrants | Ethiopia | 98.7 /100 | #108 | Exceptional 38.6% |
| Lebanese | 98.7 /100 | #109 | Exceptional 38.6% |
| Maltese | 98.6 /100 | #110 | Exceptional 38.5% |
| Crow | 98.5 /100 | #111 | Exceptional 38.5% |
| Immigrants | Scotland | 98.5 /100 | #112 | Exceptional 38.5% |
| Sub-Saharan Africans | 98.3 /100 | #113 | Exceptional 38.4% |
| Hawaiians | 98.2 /100 | #114 | Exceptional 38.4% |
| Bulgarians | 97.9 /100 | #115 | Exceptional 38.3% |