Immigrants from Norway vs Immigrants from Romania In Labor Force | Age 16-19
COMPARE
Immigrants from Norway
Immigrants from Romania
In Labor Force | Age 16-19
In Labor Force | Age 16-19 Comparison
Immigrants from Norway
Immigrants from Romania
35.9%
IN LABOR FORCE | AGE 16-19
19.8/ 100
METRIC RATING
199th/ 347
METRIC RANK
36.3%
IN LABOR FORCE | AGE 16-19
34.0/ 100
METRIC RATING
186th/ 347
METRIC RANK
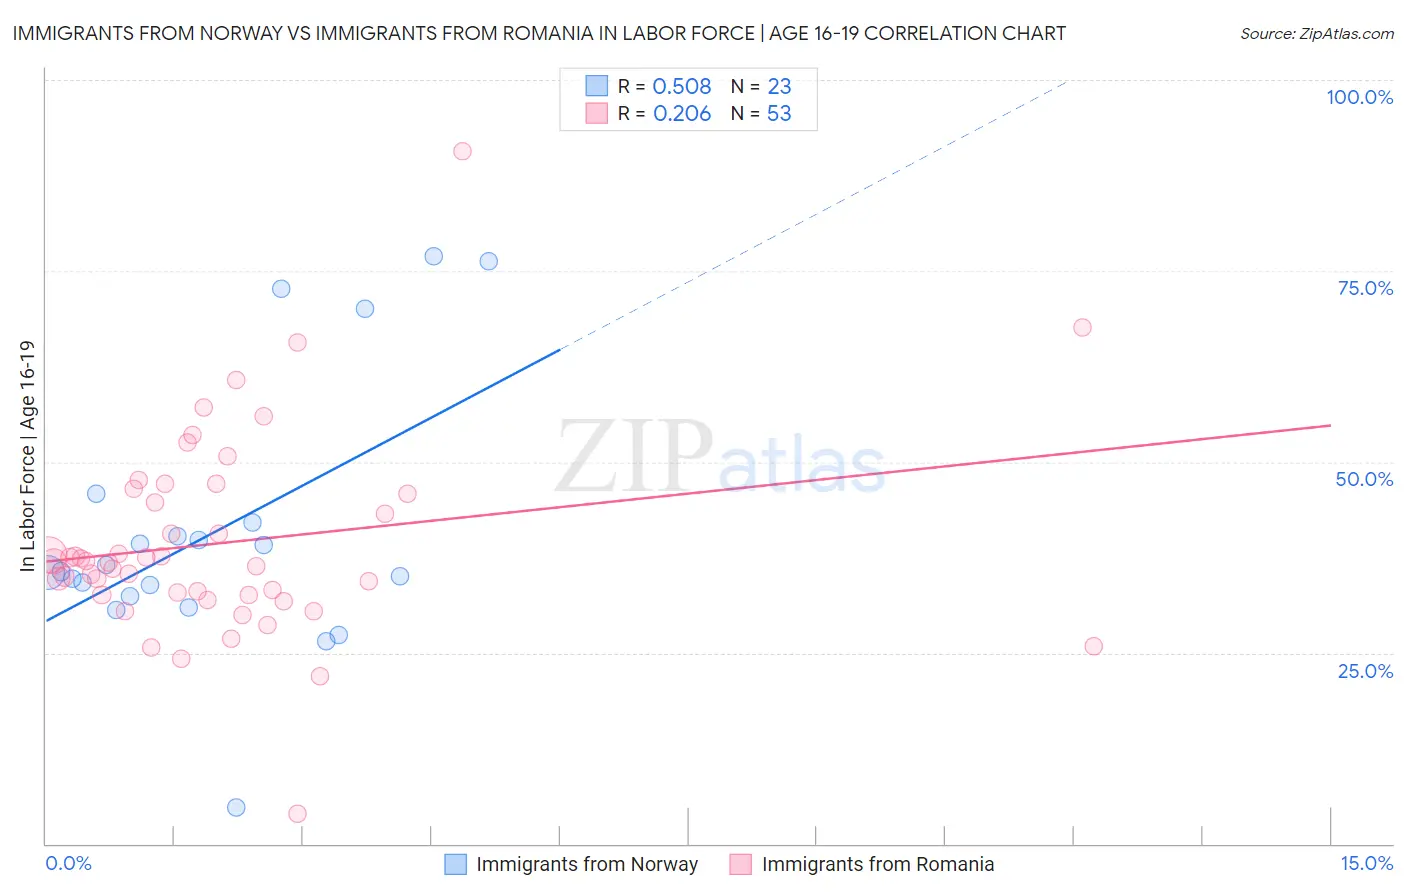
Immigrants from Norway vs Immigrants from Romania In Labor Force | Age 16-19 Correlation Chart
The statistical analysis conducted on geographies consisting of 116,617,950 people shows a substantial positive correlation between the proportion of Immigrants from Norway and labor force participation rate among population between the ages 16 and 19 in the United States with a correlation coefficient (R) of 0.508 and weighted average of 35.9%. Similarly, the statistical analysis conducted on geographies consisting of 256,696,852 people shows a weak positive correlation between the proportion of Immigrants from Romania and labor force participation rate among population between the ages 16 and 19 in the United States with a correlation coefficient (R) of 0.206 and weighted average of 36.3%, a difference of 0.94%.
In Labor Force | Age 16-19 Correlation Summary
| Measurement | Immigrants from Norway | Immigrants from Romania |
| Minimum | 4.7% | 3.9% |
| Maximum | 76.9% | 90.6% |
| Range | 72.2% | 86.7% |
| Mean | 40.9% | 39.4% |
| Median | 35.6% | 37.0% |
| Interquartile 25% (IQ1) | 32.4% | 32.6% |
| Interquartile 75% (IQ3) | 42.0% | 46.1% |
| Interquartile Range (IQR) | 9.6% | 13.6% |
| Standard Deviation (Sample) | 17.4% | 13.3% |
| Standard Deviation (Population) | 17.0% | 13.2% |
Demographics Similar to Immigrants from Norway and Immigrants from Romania by In Labor Force | Age 16-19
In terms of in labor force | age 16-19, the demographic groups most similar to Immigrants from Norway are Immigrants from Northern Africa (35.9%, a difference of 0.010%), Immigrants from Sweden (35.9%, a difference of 0.080%), Immigrants from Serbia (36.0%, a difference of 0.090%), Mexican American Indian (36.0%, a difference of 0.10%), and Alsatian (35.9%, a difference of 0.19%). Similarly, the demographic groups most similar to Immigrants from Romania are Immigrants from Afghanistan (36.3%, a difference of 0.0%), Bhutanese (36.3%, a difference of 0.070%), Costa Rican (36.3%, a difference of 0.12%), Immigrants from Europe (36.2%, a difference of 0.13%), and Eastern European (36.4%, a difference of 0.27%).
| Demographics | Rating | Rank | In Labor Force | Age 16-19 |
| Immigrants | Italy | 39.1 /100 | #182 | Fair 36.4% |
| Eastern Europeans | 38.8 /100 | #183 | Fair 36.4% |
| Costa Ricans | 36.1 /100 | #184 | Fair 36.3% |
| Bhutanese | 35.3 /100 | #185 | Fair 36.3% |
| Immigrants | Romania | 34.0 /100 | #186 | Fair 36.3% |
| Immigrants | Afghanistan | 34.0 /100 | #187 | Fair 36.3% |
| Immigrants | Europe | 31.8 /100 | #188 | Fair 36.2% |
| Immigrants | Hungary | 28.8 /100 | #189 | Fair 36.2% |
| Panamanians | 28.6 /100 | #190 | Fair 36.1% |
| Immigrants | Croatia | 27.5 /100 | #191 | Fair 36.1% |
| Afghans | 25.7 /100 | #192 | Fair 36.1% |
| Immigrants | Denmark | 25.0 /100 | #193 | Fair 36.1% |
| Nigerians | 24.6 /100 | #194 | Fair 36.1% |
| Bolivians | 23.3 /100 | #195 | Fair 36.0% |
| Mexican American Indians | 21.1 /100 | #196 | Fair 36.0% |
| Immigrants | Serbia | 21.0 /100 | #197 | Fair 36.0% |
| Immigrants | Northern Africa | 19.9 /100 | #198 | Poor 35.9% |
| Immigrants | Norway | 19.8 /100 | #199 | Poor 35.9% |
| Immigrants | Sweden | 18.8 /100 | #200 | Poor 35.9% |
| Alsatians | 17.5 /100 | #201 | Poor 35.9% |
| Senegalese | 17.4 /100 | #202 | Poor 35.9% |