Immigrants from Norway vs Sri Lankan In Labor Force | Age 16-19
COMPARE
Immigrants from Norway
Sri Lankan
In Labor Force | Age 16-19
In Labor Force | Age 16-19 Comparison
Immigrants from Norway
Sri Lankans
35.9%
IN LABOR FORCE | AGE 16-19
19.8/ 100
METRIC RATING
199th/ 347
METRIC RANK
35.5%
IN LABOR FORCE | AGE 16-19
9.8/ 100
METRIC RATING
218th/ 347
METRIC RANK
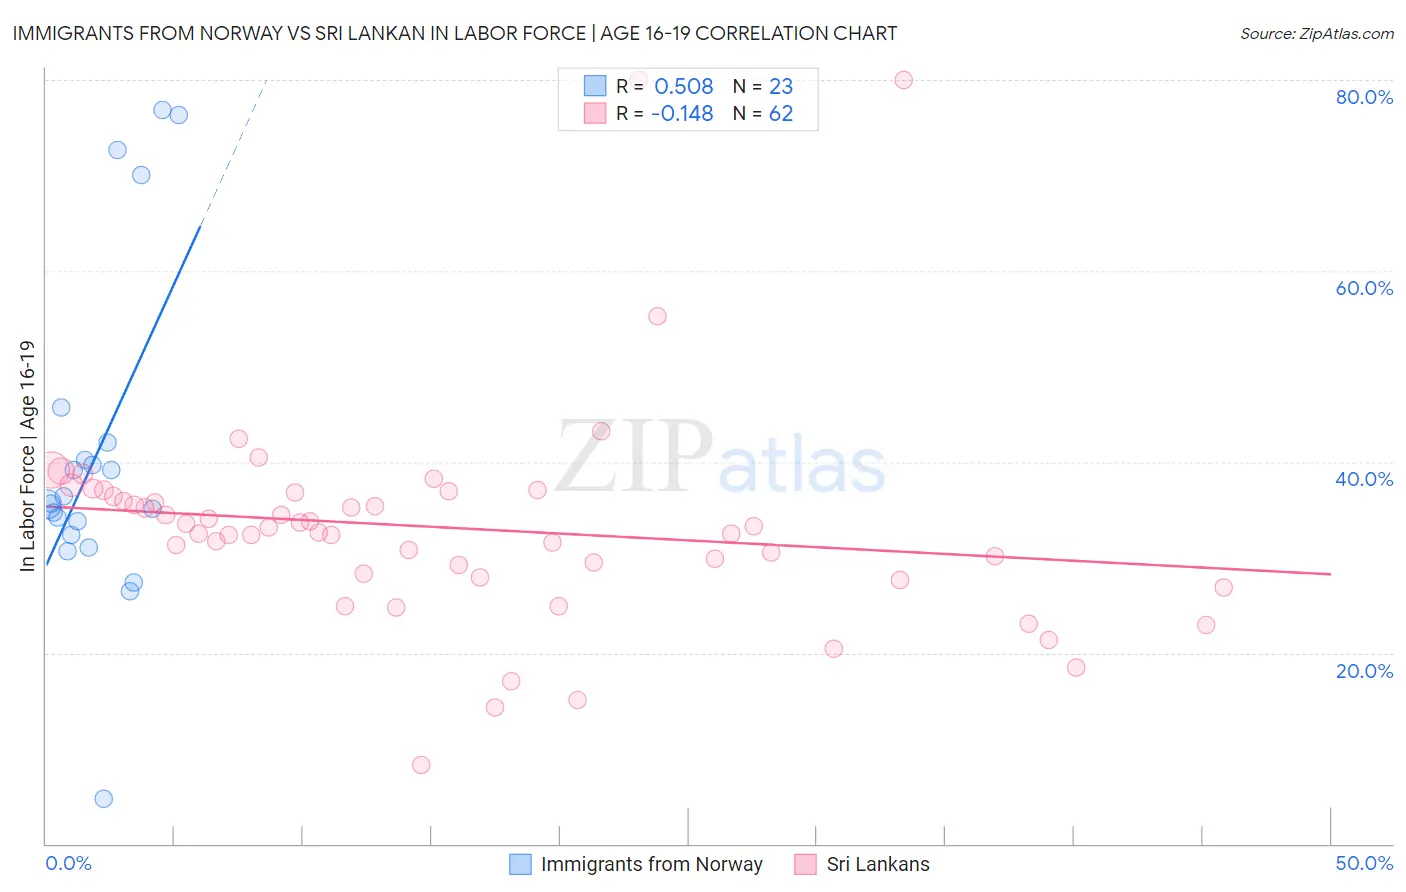
Immigrants from Norway vs Sri Lankan In Labor Force | Age 16-19 Correlation Chart
The statistical analysis conducted on geographies consisting of 116,617,950 people shows a substantial positive correlation between the proportion of Immigrants from Norway and labor force participation rate among population between the ages 16 and 19 in the United States with a correlation coefficient (R) of 0.508 and weighted average of 35.9%. Similarly, the statistical analysis conducted on geographies consisting of 440,040,037 people shows a poor negative correlation between the proportion of Sri Lankans and labor force participation rate among population between the ages 16 and 19 in the United States with a correlation coefficient (R) of -0.148 and weighted average of 35.5%, a difference of 1.1%.
In Labor Force | Age 16-19 Correlation Summary
| Measurement | Immigrants from Norway | Sri Lankan |
| Minimum | 4.7% | 8.2% |
| Maximum | 76.9% | 80.0% |
| Range | 72.2% | 71.8% |
| Mean | 40.9% | 33.1% |
| Median | 35.6% | 32.9% |
| Interquartile 25% (IQ1) | 32.4% | 28.3% |
| Interquartile 75% (IQ3) | 42.0% | 36.8% |
| Interquartile Range (IQR) | 9.6% | 8.5% |
| Standard Deviation (Sample) | 17.4% | 11.5% |
| Standard Deviation (Population) | 17.0% | 11.4% |
Demographics Similar to Immigrants from Norway and Sri Lankans by In Labor Force | Age 16-19
In terms of in labor force | age 16-19, the demographic groups most similar to Immigrants from Norway are Immigrants from Northern Africa (35.9%, a difference of 0.010%), Immigrants from Sweden (35.9%, a difference of 0.080%), Alsatian (35.9%, a difference of 0.19%), Senegalese (35.9%, a difference of 0.20%), and Immigrants from Nigeria (35.8%, a difference of 0.26%). Similarly, the demographic groups most similar to Sri Lankans are Dutch West Indian (35.6%, a difference of 0.12%), Immigrants from Costa Rica (35.6%, a difference of 0.12%), Immigrants from South Eastern Asia (35.6%, a difference of 0.14%), Apache (35.6%, a difference of 0.16%), and Houma (35.6%, a difference of 0.17%).
| Demographics | Rating | Rank | In Labor Force | Age 16-19 |
| Immigrants | Northern Africa | 19.9 /100 | #198 | Poor 35.9% |
| Immigrants | Norway | 19.8 /100 | #199 | Poor 35.9% |
| Immigrants | Sweden | 18.8 /100 | #200 | Poor 35.9% |
| Alsatians | 17.5 /100 | #201 | Poor 35.9% |
| Senegalese | 17.4 /100 | #202 | Poor 35.9% |
| Immigrants | Nigeria | 16.8 /100 | #203 | Poor 35.8% |
| Immigrants | Albania | 15.0 /100 | #204 | Poor 35.8% |
| South American Indians | 14.6 /100 | #205 | Poor 35.8% |
| Chileans | 14.6 /100 | #206 | Poor 35.8% |
| Immigrants | Eastern Europe | 14.5 /100 | #207 | Poor 35.8% |
| Koreans | 13.3 /100 | #208 | Poor 35.7% |
| Moroccans | 12.7 /100 | #209 | Poor 35.7% |
| Immigrants | Switzerland | 11.9 /100 | #210 | Poor 35.6% |
| Mexicans | 11.9 /100 | #211 | Poor 35.6% |
| Houma | 11.0 /100 | #212 | Poor 35.6% |
| Immigrants | Bolivia | 11.0 /100 | #213 | Poor 35.6% |
| Apache | 11.0 /100 | #214 | Poor 35.6% |
| Immigrants | South Eastern Asia | 10.8 /100 | #215 | Poor 35.6% |
| Dutch West Indians | 10.7 /100 | #216 | Poor 35.6% |
| Immigrants | Costa Rica | 10.7 /100 | #217 | Poor 35.6% |
| Sri Lankans | 9.8 /100 | #218 | Tragic 35.5% |