Iraqi vs Liberian In Labor Force | Age > 16
COMPARE
Iraqi
Liberian
In Labor Force | Age > 16
In Labor Force | Age > 16 Comparison
Iraqis
Liberians
65.7%
IN LABOR FORCE | AGE > 16
95.4/ 100
METRIC RATING
124th/ 347
METRIC RANK
67.8%
IN LABOR FORCE | AGE > 16
100.0/ 100
METRIC RATING
14th/ 347
METRIC RANK
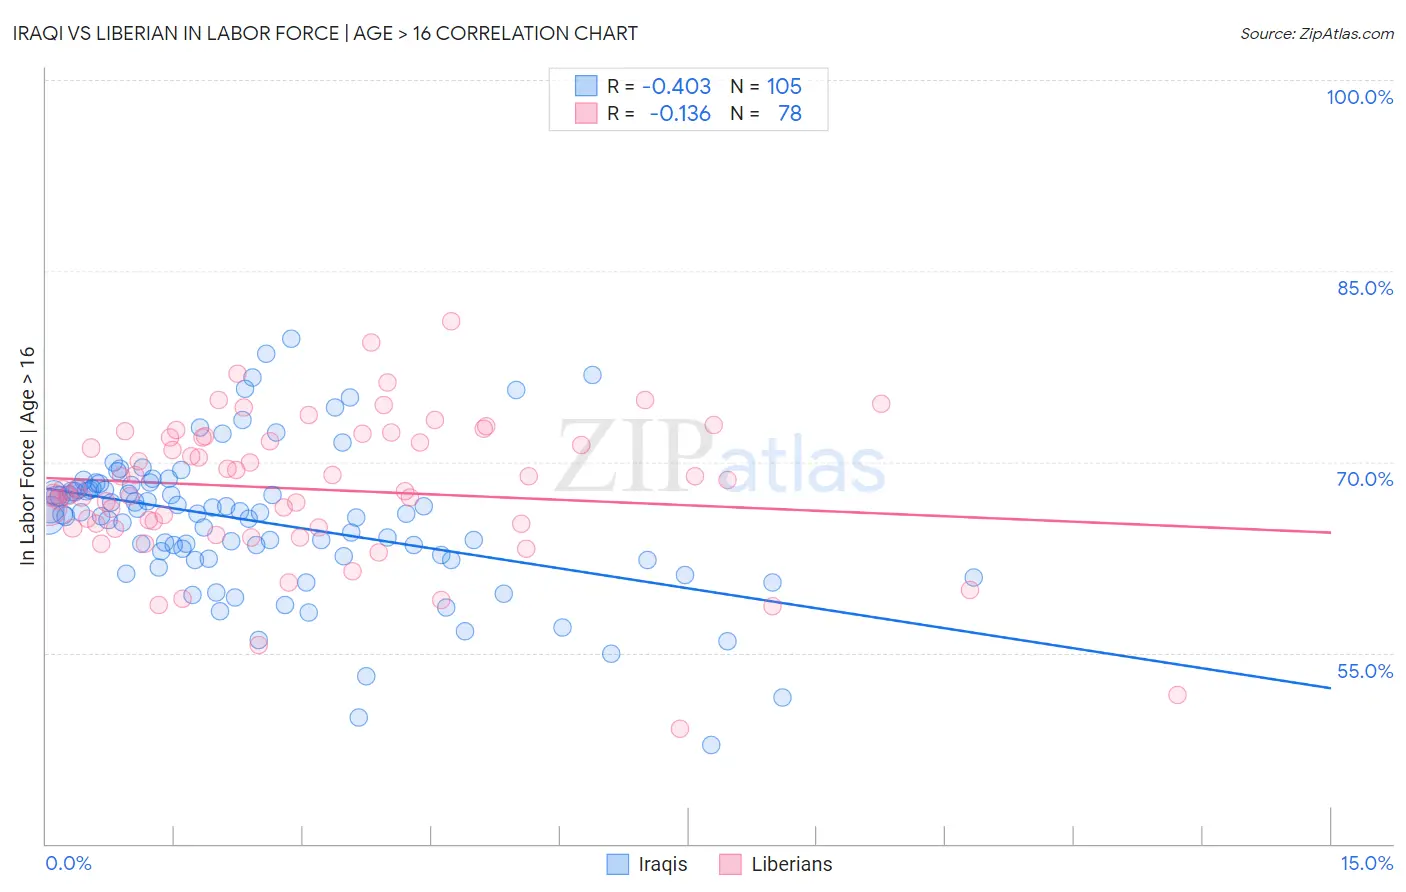
Iraqi vs Liberian In Labor Force | Age > 16 Correlation Chart
The statistical analysis conducted on geographies consisting of 170,648,723 people shows a moderate negative correlation between the proportion of Iraqis and labor force participation rate among population ages 16 and over in the United States with a correlation coefficient (R) of -0.403 and weighted average of 65.7%. Similarly, the statistical analysis conducted on geographies consisting of 118,097,222 people shows a poor negative correlation between the proportion of Liberians and labor force participation rate among population ages 16 and over in the United States with a correlation coefficient (R) of -0.136 and weighted average of 67.8%, a difference of 3.2%.
In Labor Force | Age > 16 Correlation Summary
| Measurement | Iraqi | Liberian |
| Minimum | 47.8% | 49.0% |
| Maximum | 79.7% | 81.0% |
| Range | 31.9% | 32.0% |
| Mean | 65.3% | 67.9% |
| Median | 65.9% | 67.8% |
| Interquartile 25% (IQ1) | 62.4% | 64.8% |
| Interquartile 75% (IQ3) | 67.9% | 71.9% |
| Interquartile Range (IQR) | 5.5% | 7.1% |
| Standard Deviation (Sample) | 5.7% | 5.7% |
| Standard Deviation (Population) | 5.7% | 5.6% |
Similar Demographics by In Labor Force | Age > 16
Demographics Similar to Iraqis by In Labor Force | Age > 16
In terms of in labor force | age > 16, the demographic groups most similar to Iraqis are Immigrants from Iraq (65.7%, a difference of 0.0%), Norwegian (65.7%, a difference of 0.010%), Korean (65.7%, a difference of 0.010%), Immigrants from Ecuador (65.7%, a difference of 0.030%), and Immigrants from Eastern Asia (65.7%, a difference of 0.030%).
| Demographics | Rating | Rank | In Labor Force | Age > 16 |
| Immigrants | Iran | 96.6 /100 | #117 | Exceptional 65.7% |
| Immigrants | Thailand | 96.6 /100 | #118 | Exceptional 65.7% |
| Immigrants | France | 96.4 /100 | #119 | Exceptional 65.7% |
| Immigrants | Hong Kong | 96.2 /100 | #120 | Exceptional 65.7% |
| New Zealanders | 96.0 /100 | #121 | Exceptional 65.7% |
| Immigrants | Ecuador | 95.9 /100 | #122 | Exceptional 65.7% |
| Immigrants | Iraq | 95.5 /100 | #123 | Exceptional 65.7% |
| Iraqis | 95.4 /100 | #124 | Exceptional 65.7% |
| Norwegians | 95.3 /100 | #125 | Exceptional 65.7% |
| Koreans | 95.3 /100 | #126 | Exceptional 65.7% |
| Immigrants | Eastern Asia | 94.9 /100 | #127 | Exceptional 65.7% |
| Ecuadorians | 94.7 /100 | #128 | Exceptional 65.6% |
| Immigrants | Philippines | 94.5 /100 | #129 | Exceptional 65.6% |
| Immigrants | Guatemala | 94.4 /100 | #130 | Exceptional 65.6% |
| Icelanders | 94.3 /100 | #131 | Exceptional 65.6% |
Demographics Similar to Liberians by In Labor Force | Age > 16
In terms of in labor force | age > 16, the demographic groups most similar to Liberians are Immigrants from Middle Africa (67.7%, a difference of 0.050%), Immigrants from Sudan (67.7%, a difference of 0.16%), Immigrants from India (67.6%, a difference of 0.24%), Immigrants from Liberia (67.6%, a difference of 0.25%), and Kenyan (67.6%, a difference of 0.29%).
| Demographics | Rating | Rank | In Labor Force | Age > 16 |
| Immigrants | Cameroon | 100.0 /100 | #7 | Exceptional 68.7% |
| Immigrants | Sierra Leone | 100.0 /100 | #8 | Exceptional 68.5% |
| Immigrants | Eastern Africa | 100.0 /100 | #9 | Exceptional 68.5% |
| Immigrants | Bolivia | 100.0 /100 | #10 | Exceptional 68.4% |
| Bolivians | 100.0 /100 | #11 | Exceptional 68.2% |
| Sudanese | 100.0 /100 | #12 | Exceptional 68.0% |
| Immigrants | Nepal | 100.0 /100 | #13 | Exceptional 68.0% |
| Liberians | 100.0 /100 | #14 | Exceptional 67.8% |
| Immigrants | Middle Africa | 100.0 /100 | #15 | Exceptional 67.7% |
| Immigrants | Sudan | 100.0 /100 | #16 | Exceptional 67.7% |
| Immigrants | India | 100.0 /100 | #17 | Exceptional 67.6% |
| Immigrants | Liberia | 100.0 /100 | #18 | Exceptional 67.6% |
| Kenyans | 100.0 /100 | #19 | Exceptional 67.6% |
| Immigrants | Kenya | 100.0 /100 | #20 | Exceptional 67.6% |
| Tongans | 100.0 /100 | #21 | Exceptional 67.5% |