Immigrants from Northern Africa vs Liberian Unemployment Among Youth under 25 years
COMPARE
Immigrants from Northern Africa
Liberian
Unemployment Among Youth under 25 years
Unemployment Among Youth under 25 years Comparison
Immigrants from Northern Africa
Liberians
11.5%
UNEMPLOYMENT AMONG YOUTH UNDER 25 YEARS
62.7/ 100
METRIC RATING
162nd/ 347
METRIC RANK
12.4%
UNEMPLOYMENT AMONG YOUTH UNDER 25 YEARS
0.2/ 100
METRIC RATING
256th/ 347
METRIC RANK
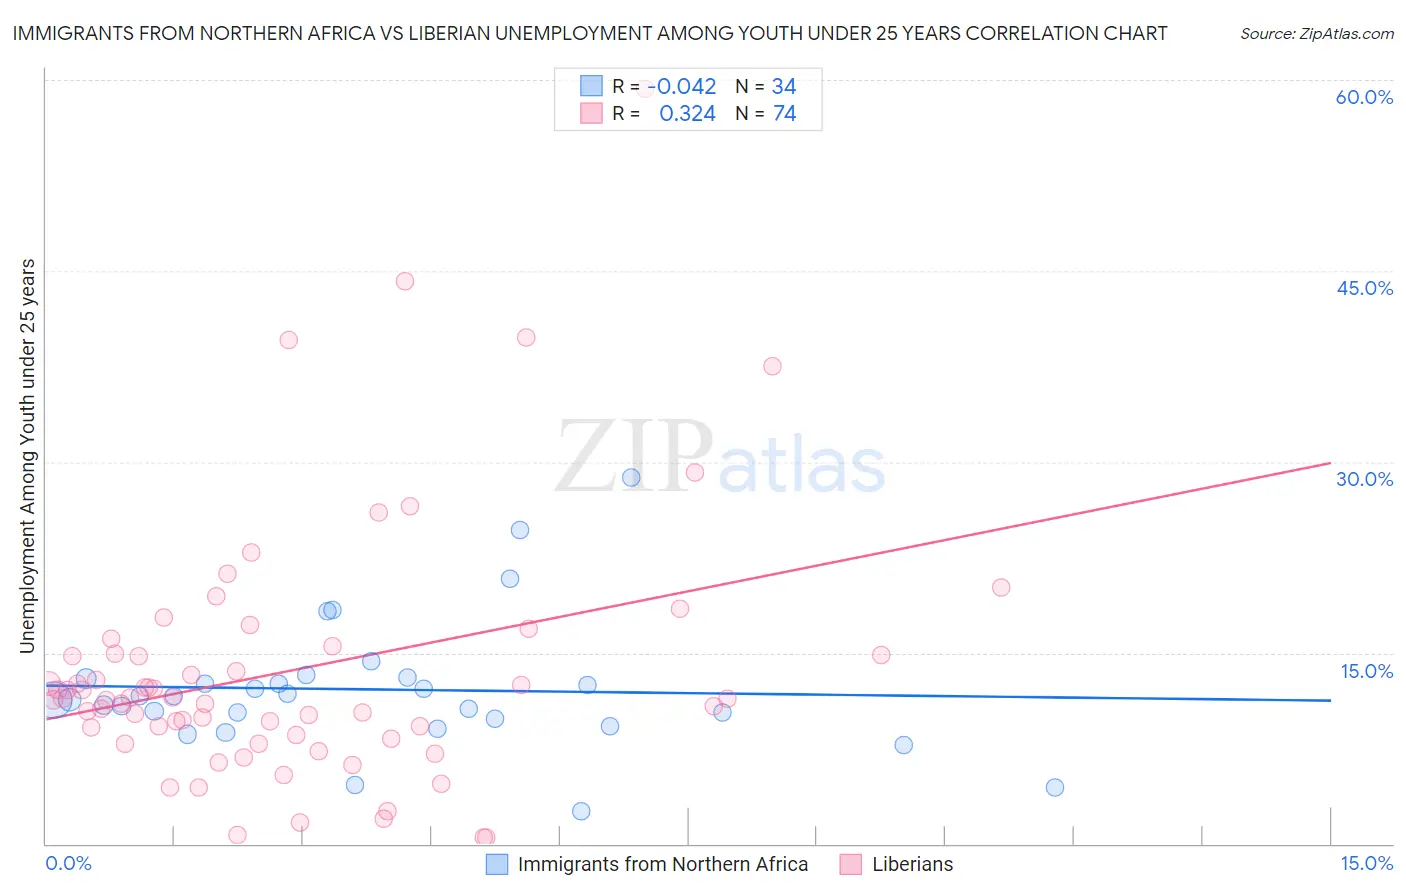
Immigrants from Northern Africa vs Liberian Unemployment Among Youth under 25 years Correlation Chart
The statistical analysis conducted on geographies consisting of 318,997,087 people shows no correlation between the proportion of Immigrants from Northern Africa and unemployment rate among youth under the age of 25 in the United States with a correlation coefficient (R) of -0.042 and weighted average of 11.5%. Similarly, the statistical analysis conducted on geographies consisting of 117,784,061 people shows a mild positive correlation between the proportion of Liberians and unemployment rate among youth under the age of 25 in the United States with a correlation coefficient (R) of 0.324 and weighted average of 12.4%, a difference of 7.2%.
Unemployment Among Youth under 25 years Correlation Summary
| Measurement | Immigrants from Northern Africa | Liberian |
| Minimum | 2.6% | 0.50% |
| Maximum | 28.8% | 59.3% |
| Range | 26.2% | 58.8% |
| Mean | 12.1% | 13.6% |
| Median | 11.4% | 11.4% |
| Interquartile 25% (IQ1) | 9.8% | 8.5% |
| Interquartile 75% (IQ3) | 13.0% | 14.9% |
| Interquartile Range (IQR) | 3.1% | 6.4% |
| Standard Deviation (Sample) | 5.2% | 10.2% |
| Standard Deviation (Population) | 5.1% | 10.2% |
Similar Demographics by Unemployment Among Youth under 25 years
Demographics Similar to Immigrants from Northern Africa by Unemployment Among Youth under 25 years
In terms of unemployment among youth under 25 years, the demographic groups most similar to Immigrants from Northern Africa are Immigrants from Kazakhstan (11.5%, a difference of 0.0%), Immigrants from Laos (11.5%, a difference of 0.010%), Immigrants from Sweden (11.5%, a difference of 0.060%), Ukrainian (11.5%, a difference of 0.070%), and Immigrants from Eastern Asia (11.5%, a difference of 0.080%).
| Demographics | Rating | Rank | Unemployment Among Youth under 25 years |
| Immigrants | Romania | 66.3 /100 | #155 | Good 11.5% |
| Immigrants | Germany | 65.9 /100 | #156 | Good 11.5% |
| Indians (Asian) | 65.1 /100 | #157 | Good 11.5% |
| Immigrants | Turkey | 64.8 /100 | #158 | Good 11.5% |
| Immigrants | Western Europe | 64.7 /100 | #159 | Good 11.5% |
| Immigrants | Eastern Asia | 64.5 /100 | #160 | Good 11.5% |
| Ukrainians | 64.3 /100 | #161 | Good 11.5% |
| Immigrants | Northern Africa | 62.7 /100 | #162 | Good 11.5% |
| Immigrants | Kazakhstan | 62.7 /100 | #163 | Good 11.5% |
| Immigrants | Laos | 62.4 /100 | #164 | Good 11.5% |
| Immigrants | Sweden | 61.3 /100 | #165 | Good 11.5% |
| Spanish | 60.3 /100 | #166 | Good 11.6% |
| Okinawans | 58.7 /100 | #167 | Average 11.6% |
| Potawatomi | 57.9 /100 | #168 | Average 11.6% |
| Eastern Europeans | 57.5 /100 | #169 | Average 11.6% |
Demographics Similar to Liberians by Unemployment Among Youth under 25 years
In terms of unemployment among youth under 25 years, the demographic groups most similar to Liberians are Panamanian (12.4%, a difference of 0.010%), Salvadoran (12.4%, a difference of 0.040%), Hispanic or Latino (12.4%, a difference of 0.070%), Immigrants from Central America (12.4%, a difference of 0.10%), and Immigrants from Panama (12.4%, a difference of 0.39%).
| Demographics | Rating | Rank | Unemployment Among Youth under 25 years |
| Soviet Union | 0.6 /100 | #249 | Tragic 12.2% |
| Delaware | 0.4 /100 | #250 | Tragic 12.3% |
| Mexican American Indians | 0.4 /100 | #251 | Tragic 12.3% |
| Immigrants | Syria | 0.3 /100 | #252 | Tragic 12.3% |
| Mexicans | 0.3 /100 | #253 | Tragic 12.3% |
| Hondurans | 0.3 /100 | #254 | Tragic 12.3% |
| Hispanics or Latinos | 0.2 /100 | #255 | Tragic 12.4% |
| Liberians | 0.2 /100 | #256 | Tragic 12.4% |
| Panamanians | 0.2 /100 | #257 | Tragic 12.4% |
| Salvadorans | 0.1 /100 | #258 | Tragic 12.4% |
| Immigrants | Central America | 0.1 /100 | #259 | Tragic 12.4% |
| Immigrants | Panama | 0.1 /100 | #260 | Tragic 12.4% |
| Immigrants | El Salvador | 0.1 /100 | #261 | Tragic 12.4% |
| Immigrants | Mexico | 0.1 /100 | #262 | Tragic 12.4% |
| Cree | 0.1 /100 | #263 | Tragic 12.4% |