Ukrainian vs Liberian In Labor Force | Age > 16
COMPARE
Ukrainian
Liberian
In Labor Force | Age > 16
In Labor Force | Age > 16 Comparison
Ukrainians
Liberians
64.9%
IN LABOR FORCE | AGE > 16
19.6/ 100
METRIC RATING
201st/ 347
METRIC RANK
67.8%
IN LABOR FORCE | AGE > 16
100.0/ 100
METRIC RATING
14th/ 347
METRIC RANK
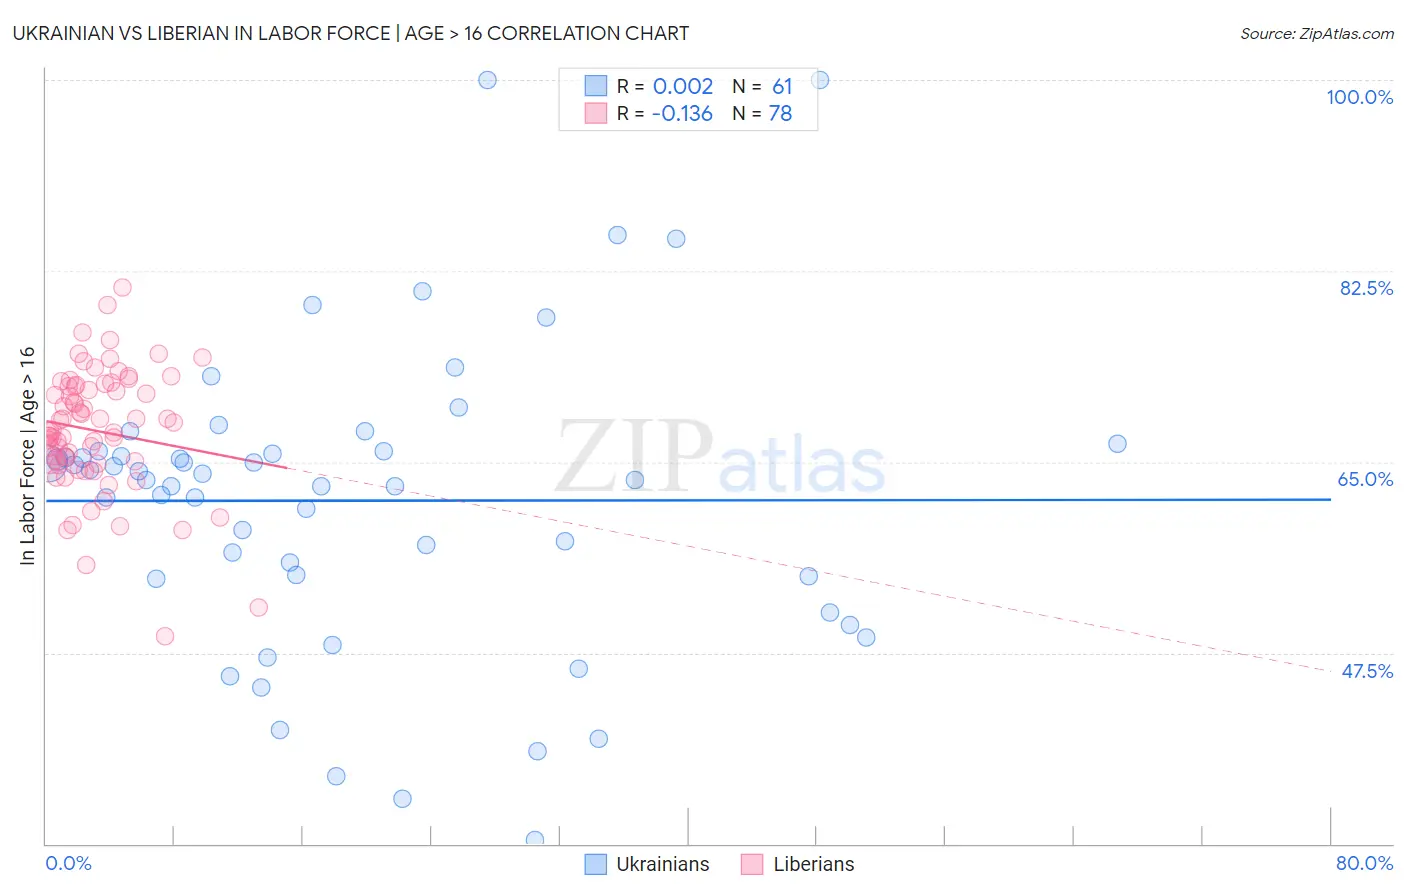
Ukrainian vs Liberian In Labor Force | Age > 16 Correlation Chart
The statistical analysis conducted on geographies consisting of 448,710,826 people shows no correlation between the proportion of Ukrainians and labor force participation rate among population ages 16 and over in the United States with a correlation coefficient (R) of 0.002 and weighted average of 64.9%. Similarly, the statistical analysis conducted on geographies consisting of 118,097,222 people shows a poor negative correlation between the proportion of Liberians and labor force participation rate among population ages 16 and over in the United States with a correlation coefficient (R) of -0.136 and weighted average of 67.8%, a difference of 4.5%.
In Labor Force | Age > 16 Correlation Summary
| Measurement | Ukrainian | Liberian |
| Minimum | 30.4% | 49.0% |
| Maximum | 100.0% | 81.0% |
| Range | 69.6% | 32.0% |
| Mean | 61.4% | 67.9% |
| Median | 63.4% | 67.8% |
| Interquartile 25% (IQ1) | 54.4% | 64.8% |
| Interquartile 75% (IQ3) | 66.0% | 71.9% |
| Interquartile Range (IQR) | 11.6% | 7.1% |
| Standard Deviation (Sample) | 13.8% | 5.7% |
| Standard Deviation (Population) | 13.7% | 5.6% |
Similar Demographics by In Labor Force | Age > 16
Demographics Similar to Ukrainians by In Labor Force | Age > 16
In terms of in labor force | age > 16, the demographic groups most similar to Ukrainians are Immigrants from Belgium (64.9%, a difference of 0.0%), Armenian (64.9%, a difference of 0.010%), Russian (64.9%, a difference of 0.010%), Slovene (64.9%, a difference of 0.020%), and Jamaican (64.9%, a difference of 0.020%).
| Demographics | Rating | Rank | In Labor Force | Age > 16 |
| Immigrants | Southern Europe | 31.3 /100 | #194 | Fair 65.0% |
| Romanians | 31.1 /100 | #195 | Fair 65.0% |
| Haitians | 30.6 /100 | #196 | Fair 65.0% |
| Immigrants | Italy | 28.7 /100 | #197 | Fair 65.0% |
| Greeks | 26.1 /100 | #198 | Fair 64.9% |
| Mexican American Indians | 23.1 /100 | #199 | Fair 64.9% |
| Armenians | 20.2 /100 | #200 | Fair 64.9% |
| Ukrainians | 19.6 /100 | #201 | Poor 64.9% |
| Immigrants | Belgium | 19.4 /100 | #202 | Poor 64.9% |
| Russians | 18.8 /100 | #203 | Poor 64.9% |
| Slovenes | 18.7 /100 | #204 | Poor 64.9% |
| Jamaicans | 18.7 /100 | #205 | Poor 64.9% |
| Lithuanians | 17.4 /100 | #206 | Poor 64.8% |
| Immigrants | Latin America | 16.4 /100 | #207 | Poor 64.8% |
| Belizeans | 16.2 /100 | #208 | Poor 64.8% |
Demographics Similar to Liberians by In Labor Force | Age > 16
In terms of in labor force | age > 16, the demographic groups most similar to Liberians are Immigrants from Middle Africa (67.7%, a difference of 0.050%), Immigrants from Sudan (67.7%, a difference of 0.16%), Immigrants from India (67.6%, a difference of 0.24%), Immigrants from Liberia (67.6%, a difference of 0.25%), and Kenyan (67.6%, a difference of 0.29%).
| Demographics | Rating | Rank | In Labor Force | Age > 16 |
| Immigrants | Cameroon | 100.0 /100 | #7 | Exceptional 68.7% |
| Immigrants | Sierra Leone | 100.0 /100 | #8 | Exceptional 68.5% |
| Immigrants | Eastern Africa | 100.0 /100 | #9 | Exceptional 68.5% |
| Immigrants | Bolivia | 100.0 /100 | #10 | Exceptional 68.4% |
| Bolivians | 100.0 /100 | #11 | Exceptional 68.2% |
| Sudanese | 100.0 /100 | #12 | Exceptional 68.0% |
| Immigrants | Nepal | 100.0 /100 | #13 | Exceptional 68.0% |
| Liberians | 100.0 /100 | #14 | Exceptional 67.8% |
| Immigrants | Middle Africa | 100.0 /100 | #15 | Exceptional 67.7% |
| Immigrants | Sudan | 100.0 /100 | #16 | Exceptional 67.7% |
| Immigrants | India | 100.0 /100 | #17 | Exceptional 67.6% |
| Immigrants | Liberia | 100.0 /100 | #18 | Exceptional 67.6% |
| Kenyans | 100.0 /100 | #19 | Exceptional 67.6% |
| Immigrants | Kenya | 100.0 /100 | #20 | Exceptional 67.6% |
| Tongans | 100.0 /100 | #21 | Exceptional 67.5% |