Immigrants from Nigeria vs Immigrants from Argentina In Labor Force | Age 45-54
COMPARE
Immigrants from Nigeria
Immigrants from Argentina
In Labor Force | Age 45-54
In Labor Force | Age 45-54 Comparison
Immigrants from Nigeria
Immigrants from Argentina
83.0%
IN LABOR FORCE | AGE 45-54
74.1/ 100
METRIC RATING
148th/ 347
METRIC RANK
83.3%
IN LABOR FORCE | AGE 45-54
94.9/ 100
METRIC RATING
95th/ 347
METRIC RANK
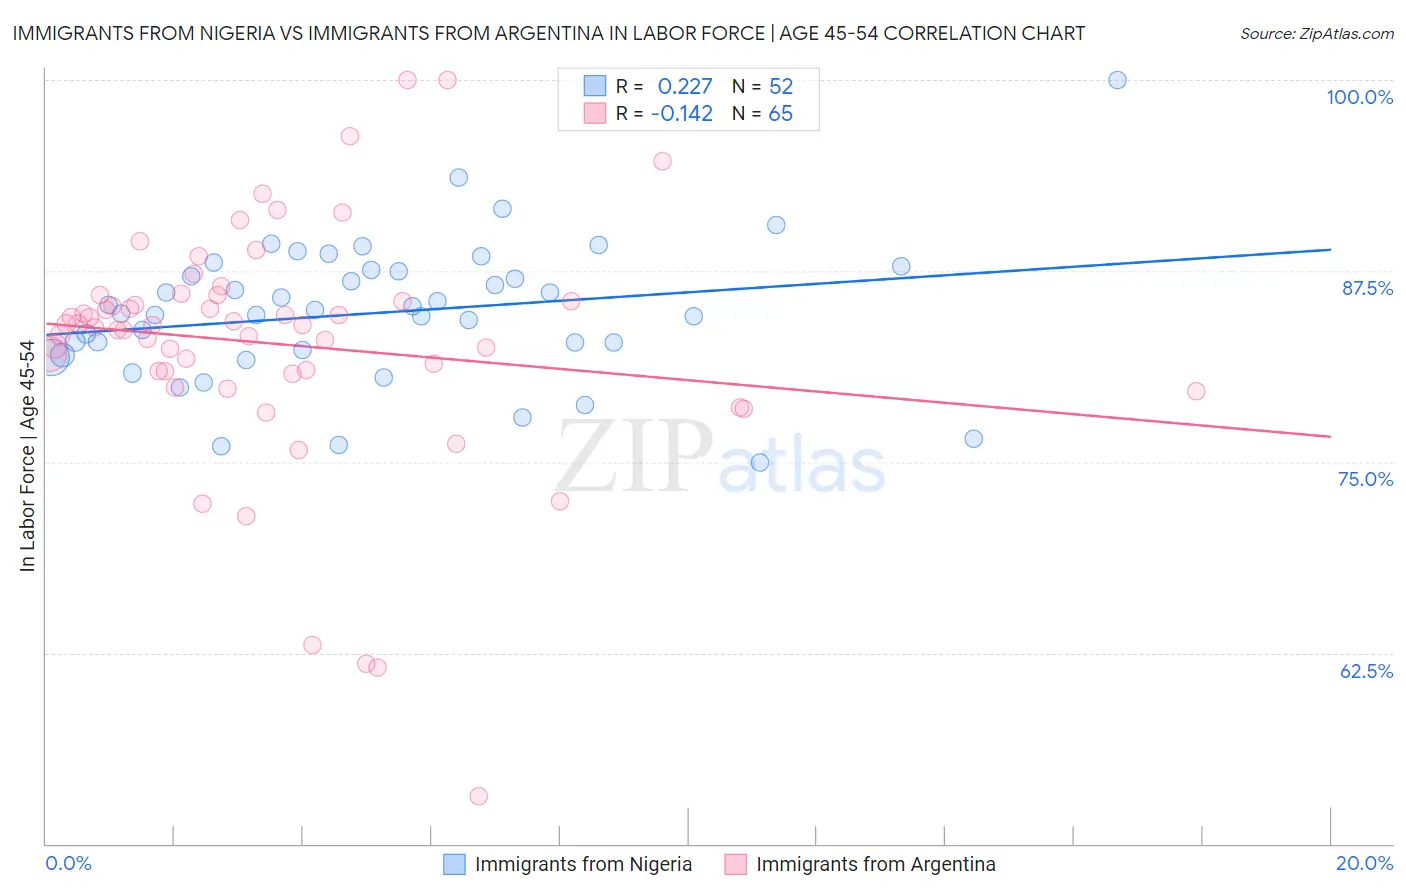
Immigrants from Nigeria vs Immigrants from Argentina In Labor Force | Age 45-54 Correlation Chart
The statistical analysis conducted on geographies consisting of 283,287,443 people shows a weak positive correlation between the proportion of Immigrants from Nigeria and labor force participation rate among population between the ages 45 and 54 in the United States with a correlation coefficient (R) of 0.227 and weighted average of 83.0%. Similarly, the statistical analysis conducted on geographies consisting of 264,349,552 people shows a poor negative correlation between the proportion of Immigrants from Argentina and labor force participation rate among population between the ages 45 and 54 in the United States with a correlation coefficient (R) of -0.142 and weighted average of 83.3%, a difference of 0.41%.
In Labor Force | Age 45-54 Correlation Summary
| Measurement | Immigrants from Nigeria | Immigrants from Argentina |
| Minimum | 75.0% | 53.1% |
| Maximum | 100.0% | 100.0% |
| Range | 25.0% | 46.9% |
| Mean | 84.8% | 82.7% |
| Median | 84.8% | 83.9% |
| Interquartile 25% (IQ1) | 82.2% | 80.8% |
| Interquartile 75% (IQ3) | 87.5% | 85.7% |
| Interquartile Range (IQR) | 5.3% | 4.9% |
| Standard Deviation (Sample) | 4.6% | 8.1% |
| Standard Deviation (Population) | 4.6% | 8.0% |
Similar Demographics by In Labor Force | Age 45-54
Demographics Similar to Immigrants from Nigeria by In Labor Force | Age 45-54
In terms of in labor force | age 45-54, the demographic groups most similar to Immigrants from Nigeria are Immigrants from France (83.0%, a difference of 0.010%), Czechoslovakian (83.0%, a difference of 0.010%), Immigrants from Sweden (82.9%, a difference of 0.010%), Romanian (83.0%, a difference of 0.020%), and Immigrants from Netherlands (82.9%, a difference of 0.020%).
| Demographics | Rating | Rank | In Labor Force | Age 45-54 |
| Immigrants | Haiti | 77.9 /100 | #141 | Good 83.0% |
| Immigrants | Scotland | 77.8 /100 | #142 | Good 83.0% |
| Okinawans | 77.0 /100 | #143 | Good 83.0% |
| Soviet Union | 76.8 /100 | #144 | Good 83.0% |
| Romanians | 75.4 /100 | #145 | Good 83.0% |
| Immigrants | France | 75.3 /100 | #146 | Good 83.0% |
| Czechoslovakians | 74.8 /100 | #147 | Good 83.0% |
| Immigrants | Nigeria | 74.1 /100 | #148 | Good 83.0% |
| Immigrants | Sweden | 73.3 /100 | #149 | Good 82.9% |
| Immigrants | Netherlands | 72.6 /100 | #150 | Good 82.9% |
| Koreans | 71.9 /100 | #151 | Good 82.9% |
| Slavs | 71.5 /100 | #152 | Good 82.9% |
| Immigrants | Indonesia | 70.6 /100 | #153 | Good 82.9% |
| Immigrants | Ghana | 70.3 /100 | #154 | Good 82.9% |
| Immigrants | Philippines | 69.0 /100 | #155 | Good 82.9% |
Demographics Similar to Immigrants from Argentina by In Labor Force | Age 45-54
In terms of in labor force | age 45-54, the demographic groups most similar to Immigrants from Argentina are Argentinean (83.3%, a difference of 0.0%), Immigrants from Kuwait (83.3%, a difference of 0.0%), Palestinian (83.3%, a difference of 0.0%), Italian (83.3%, a difference of 0.010%), and Danish (83.3%, a difference of 0.020%).
| Demographics | Rating | Rank | In Labor Force | Age 45-54 |
| Immigrants | Asia | 95.6 /100 | #88 | Exceptional 83.3% |
| Indians (Asian) | 95.5 /100 | #89 | Exceptional 83.3% |
| Immigrants | Japan | 95.5 /100 | #90 | Exceptional 83.3% |
| South Americans | 95.5 /100 | #91 | Exceptional 83.3% |
| Danes | 95.3 /100 | #92 | Exceptional 83.3% |
| Italians | 95.1 /100 | #93 | Exceptional 83.3% |
| Argentineans | 94.9 /100 | #94 | Exceptional 83.3% |
| Immigrants | Argentina | 94.9 /100 | #95 | Exceptional 83.3% |
| Immigrants | Kuwait | 94.8 /100 | #96 | Exceptional 83.3% |
| Palestinians | 94.8 /100 | #97 | Exceptional 83.3% |
| Maltese | 94.4 /100 | #98 | Exceptional 83.3% |
| Immigrants | Middle Africa | 94.3 /100 | #99 | Exceptional 83.3% |
| Mongolians | 94.2 /100 | #100 | Exceptional 83.3% |
| Immigrants | Belarus | 94.1 /100 | #101 | Exceptional 83.3% |
| Immigrants | Singapore | 93.9 /100 | #102 | Exceptional 83.3% |