Immigrants from Nigeria vs Portuguese In Labor Force | Age 45-54

COMPARE

Immigrants from Nigeria
Race
Ancestry
AfghanAfricanAlaska NativeAlaskan AthabascanAlbanianAleutAlsatianAmericanApacheArabArapahoArgentineanArmenianAssyrian/Chaldean/SyriacAustralianAustrianBahamianBangladeshiBarbadianBasqueBelgianBelizeanBermudanBhutaneseBlackfeetBolivianBrazilianBritishBritish West IndianBulgarianBurmeseCajunCambodianCanadianCape VerdeanCarpatho RusynCelticCentral AmericanCentral American IndianCherokeeCheyenneChickasawChileanChineseChippewaChoctawColombianColvilleComancheCosta RicanCreeCreekCroatianCrowCubanCypriotCzechCzechoslovakianDanishDelawareDominicanDutchDutch West IndianEastern EuropeanEcuadorianEgyptianEnglishEstonianEthiopianEuropeanFijianFilipinoFinnishFrenchFrench American IndianFrench CanadianGermanGerman RussianGhanaianGreekGuamanian/ChamorroGuatemalanGuyaneseHaitianHmongHonduranHopiHoumaHungarianIcelanderIndian (Asian)IndonesianInupiatIranianIraqiIrishIroquoisIsraeliItalianJamaicanJapaneseJordanianKenyanKiowaKoreanLaotianLatvianLebaneseLiberianLithuanianLumbeeLuxembourgerMacedonianMalaysianMalteseMarshalleseMenomineeMexicanMexican American IndianMongolianMoroccanNative HawaiianNavajoNepaleseNew ZealanderNicaraguanNigerianNorthern EuropeanNorwegianOkinawanOsageOttawaPaiutePakistaniPalestinianPanamanianParaguayanPennsylvania GermanPeruvianPimaPolishPotawatomiPuebloPuerto RicanPuget Sound SalishRomanianRussianSalvadoranSamoanScandinavianScotch-IrishScottishSeminoleSenegaleseSerbianShoshoneSierra LeoneanSiouxSlavicSlovakSloveneSomaliSouth AfricanSouth AmericanSouth American IndianSoviet UnionSpaniardSpanishSpanish AmericanSpanish American IndianSri LankanSubsaharan AfricanSudaneseSwedishSwissSyrianTaiwaneseThaiTlingit-HaidaTohono O'OdhamTonganTrinidadian and TobagonianTsimshianTurkishU.S. Virgin IslanderUgandanUkrainianUruguayanUteVenezuelanVietnameseWelshWest IndianYakamaYaquiYugoslavianYumanYup'ikZimbabwean
Immigration
NonimmigrantsImmigrantsAfghanistanAfricaAlbaniaArgentinaArmeniaAsiaAustraliaAustriaBahamasBangladeshBarbadosBelarusBelgiumBelizeBoliviaBosnia and HerzegovinaBrazilBulgariaBurma/MyanmarCabo VerdeCambodiaCameroonCanadaCaribbeanCentral AmericaChileChinaColombiaCongoCosta RicaCroatiaCubaCzechoslovakiaDenmarkDominicaDominican RepublicEastern AfricaEastern AsiaEastern EuropeEcuadorEgyptEl SalvadorEnglandEritreaEthiopiaEuropeFijiFranceGermanyGhanaGreeceGrenadaGuatemalaGuyanaHaitiHondurasHong KongHungaryIndiaIndonesiaIranIraqIrelandIsraelItalyJamaicaJapanJordanKazakhstanKenyaKoreaKuwaitLaosLatin AmericaLatviaLebanonLiberiaLithuaniaMalaysiaMexicoMicronesiaMiddle AfricaMoldovaMoroccoNepalNetherlandsNicaraguaNigeriaNorth AmericaNorth MacedoniaNorthern AfricaNorthern EuropeNorwayOceaniaPakistanPanamaPeruPhilippinesPolandPortugalRomaniaRussiaSaudi ArabiaScotlandSenegalSerbiaSierra LeoneSingaporeSomaliaSouth AfricaSouth AmericaSouth Central AsiaSouth Eastern AsiaSouthern EuropeSpainSri LankaSt. Vincent and the GrenadinesSudanSwedenSwitzerlandSyriaTaiwanThailandTrinidad and TobagoTurkeyUgandaUkraineUruguayUzbekistanVenezuelaVietnamWest IndiesWestern AfricaWestern AsiaWestern EuropeYemenZaireZimbabweAzores
Portuguese
Race
Ancestry
AfghanAfricanAlaska NativeAlaskan AthabascanAlbanianAleutAlsatianAmericanApacheArabArapahoArgentineanArmenianAssyrian/Chaldean/SyriacAustralianAustrianBahamianBangladeshiBarbadianBasqueBelgianBelizeanBermudanBhutaneseBlackfeetBolivianBrazilianBritishBritish West IndianBulgarianBurmeseCajunCambodianCanadianCape VerdeanCarpatho RusynCelticCentral AmericanCentral American IndianCherokeeCheyenneChickasawChileanChineseChippewaChoctawColombianColvilleComancheCosta RicanCreeCreekCroatianCrowCubanCypriotCzechCzechoslovakianDanishDelawareDominicanDutchDutch West IndianEastern EuropeanEcuadorianEgyptianEnglishEstonianEthiopianEuropeanFijianFilipinoFinnishFrenchFrench American IndianFrench CanadianGermanGerman RussianGhanaianGreekGuamanian/ChamorroGuatemalanGuyaneseHaitianHmongHonduranHopiHoumaHungarianIcelanderIndian (Asian)IndonesianInupiatIranianIraqiIrishIroquoisIsraeliItalianJamaicanJapaneseJordanianKenyanKiowaKoreanLaotianLatvianLebaneseLiberianLithuanianLumbeeLuxembourgerMacedonianMalaysianMalteseMarshalleseMenomineeMexicanMexican American IndianMongolianMoroccanNative HawaiianNavajoNepaleseNew ZealanderNicaraguanNigerianNorthern EuropeanNorwegianOkinawanOsageOttawaPaiutePakistaniPalestinianPanamanianParaguayanPennsylvania GermanPeruvianPimaPolishPortuguesePotawatomiPuebloPuerto RicanPuget Sound SalishRomanianRussianSalvadoranSamoanScandinavianScotch-IrishScottishSeminoleSenegaleseSerbianShoshoneSierra LeoneanSiouxSlavicSlovakSloveneSomaliSouth AfricanSouth AmericanSouth American IndianSoviet UnionSpaniardSpanishSpanish AmericanSpanish American IndianSri LankanSubsaharan AfricanSudaneseSwedishSwissSyrianTaiwaneseThaiTlingit-HaidaTohono O'OdhamTonganTrinidadian and TobagonianTsimshianTurkishU.S. Virgin IslanderUgandanUkrainianUruguayanUteVenezuelanVietnameseWelshWest IndianYakamaYaquiYugoslavianYumanYup'ikZimbabwean
Immigration
NonimmigrantsImmigrantsAfghanistanAfricaAlbaniaArgentinaArmeniaAsiaAustraliaAustriaBahamasBangladeshBarbadosBelarusBelgiumBelizeBoliviaBosnia and HerzegovinaBrazilBulgariaBurma/MyanmarCabo VerdeCambodiaCameroonCanadaCaribbeanCentral AmericaChileChinaColombiaCongoCosta RicaCroatiaCubaCzechoslovakiaDenmarkDominicaDominican RepublicEastern AfricaEastern AsiaEastern EuropeEcuadorEgyptEl SalvadorEnglandEritreaEthiopiaEuropeFijiFranceGermanyGhanaGreeceGrenadaGuatemalaGuyanaHaitiHondurasHong KongHungaryIndiaIndonesiaIranIraqIrelandIsraelItalyJamaicaJapanJordanKazakhstanKenyaKoreaKuwaitLaosLatin AmericaLatviaLebanonLiberiaLithuaniaMalaysiaMexicoMicronesiaMiddle AfricaMoldovaMoroccoNepalNetherlandsNicaraguaNorth AmericaNorth MacedoniaNorthern AfricaNorthern EuropeNorwayOceaniaPakistanPanamaPeruPhilippinesPolandPortugalRomaniaRussiaSaudi ArabiaScotlandSenegalSerbiaSierra LeoneSingaporeSomaliaSouth AfricaSouth AmericaSouth Central AsiaSouth Eastern AsiaSouthern EuropeSpainSri LankaSt. Vincent and the GrenadinesSudanSwedenSwitzerlandSyriaTaiwanThailandTrinidad and TobagoTurkeyUgandaUkraineUruguayUzbekistanVenezuelaVietnamWest IndiesWestern AfricaWestern AsiaWestern EuropeYemenZaireZimbabweAzores
In Labor Force | Age 45-54
Income
Poverty
Unemployment
Labor Participation
Family Structure
Vehicle Availability
Education Level
Disability

In Labor Force | Age 45-54 Comparison

Immigrants from Nigeria

Portuguese

Good
Tragic
83.0%
IN LABOR FORCE | AGE 45-54
74.1/ 100
METRIC RATING
148th/ 347
METRIC RANK
82.2%
IN LABOR FORCE | AGE 45-54
4.7/ 100
METRIC RATING
217th/ 347
METRIC RANK

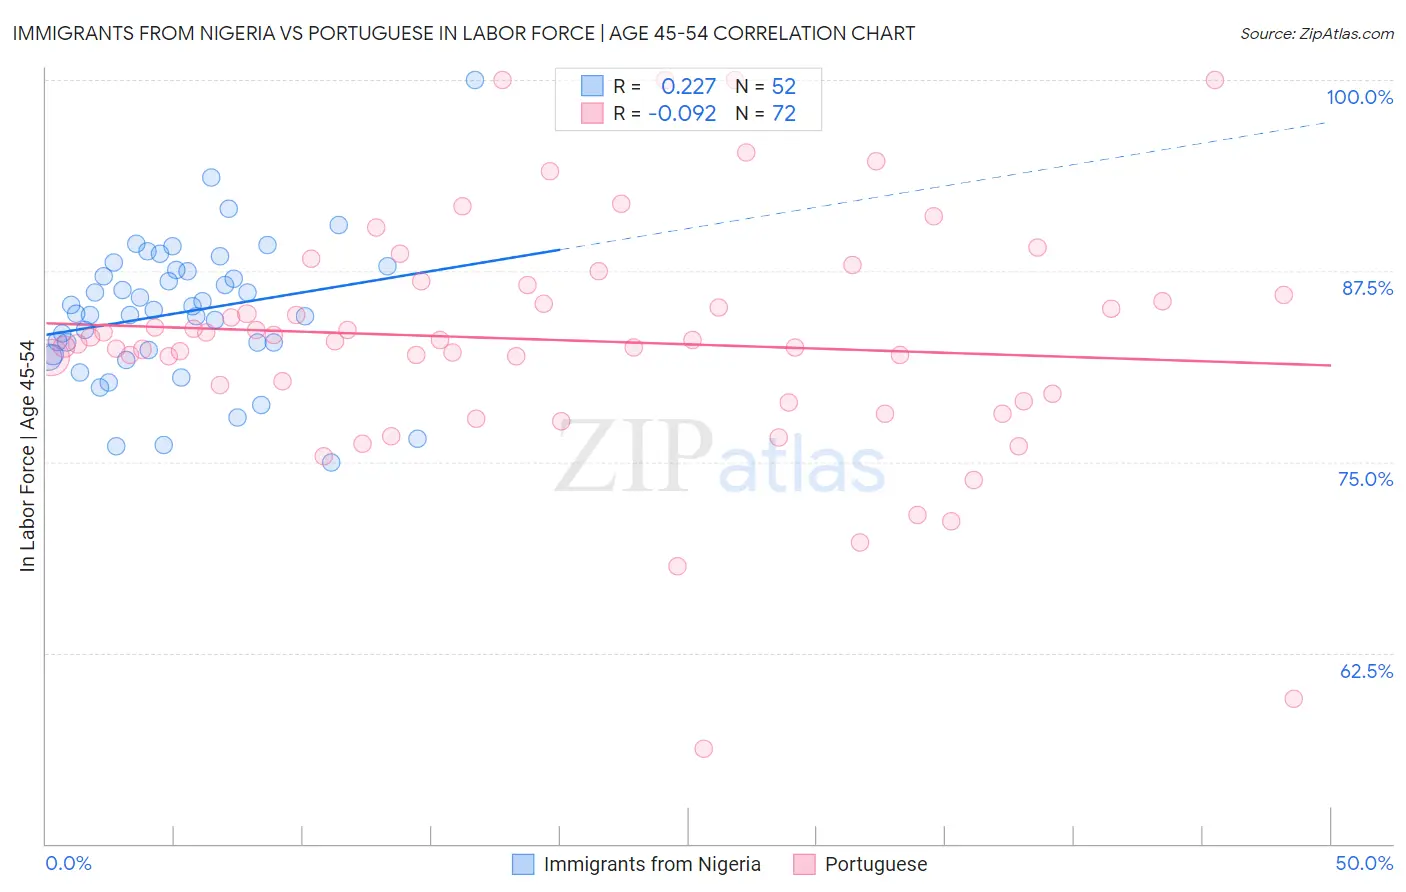
Immigrants from Nigeria vs Portuguese In Labor Force | Age 45-54 Correlation Chart

The statistical analysis conducted on geographies consisting of 283,287,443 people shows a weak positive correlation between the proportion of Immigrants from Nigeria and labor force participation rate among population between the ages 45 and 54 in the United States with a correlation coefficient (R) of 0.227 and weighted average of 83.0%. Similarly, the statistical analysis conducted on geographies consisting of 449,955,919 people shows a slight negative correlation between the proportion of Portuguese and labor force participation rate among population between the ages 45 and 54 in the United States with a correlation coefficient (R) of -0.092 and weighted average of 82.2%, a difference of 0.90%.
Immigrants from Nigeria vs Portuguese In Labor Force | Age 45-54

In Labor Force | Age 45-54 Correlation Summary

MeasurementImmigrants from NigeriaPortuguese
Minimum75.0%56.2%
Maximum100.0%100.0%
Range25.0%43.8%
Mean84.8%83.0%
Median84.8%82.9%
Interquartile 25% (IQ1)82.2%79.2%
Interquartile 75% (IQ3)87.5%86.2%
Interquartile Range (IQR)5.3%7.0%
Standard Deviation (Sample)4.6%7.9%
Standard Deviation (Population)4.6%7.9%

Similar Demographics by In Labor Force | Age 45-54

Demographics Similar to Immigrants from Nigeria by In Labor Force | Age 45-54

In terms of in labor force | age 45-54, the demographic groups most similar to Immigrants from Nigeria are Immigrants from France (83.0%, a difference of 0.010%), Czechoslovakian (83.0%, a difference of 0.010%), Immigrants from Sweden (82.9%, a difference of 0.010%), Romanian (83.0%, a difference of 0.020%), and Immigrants from Netherlands (82.9%, a difference of 0.020%).
DemographicsRating | RankIn Labor Force | Age 45-54
Immigrants | Haiti
77.9
/100
|
#141
Good
83.0%
Immigrants | Scotland
77.8
/100
|
#142
Good
83.0%
Okinawans
77.0
/100
|
#143
Good
83.0%
Soviet Union
76.8
/100
|
#144
Good
83.0%
Romanians
75.4
/100
|
#145
Good
83.0%
Immigrants | France
75.3
/100
|
#146
Good
83.0%
Czechoslovakians
74.8
/100
|
#147
Good
83.0%
Immigrants | Nigeria
74.1
/100
|
#148
Good
83.0%
Immigrants | Sweden
73.3
/100
|
#149
Good
82.9%
Immigrants | Netherlands
72.6
/100
|
#150
Good
82.9%
Koreans
71.9
/100
|
#151
Good
82.9%
Slavs
71.5
/100
|
#152
Good
82.9%
Immigrants | Indonesia
70.6
/100
|
#153
Good
82.9%
Immigrants | Ghana
70.3
/100
|
#154
Good
82.9%
Immigrants | Philippines
69.0
/100
|
#155
Good
82.9%

Demographics Similar to Portuguese by In Labor Force | Age 45-54

In terms of in labor force | age 45-54, the demographic groups most similar to Portuguese are English (82.2%, a difference of 0.020%), Scottish (82.2%, a difference of 0.030%), French (82.2%, a difference of 0.030%), Immigrants from Panama (82.2%, a difference of 0.040%), and Iraqi (82.2%, a difference of 0.040%).
DemographicsRating | RankIn Labor Force | Age 45-54
Immigrants | Bahamas
7.1
/100
|
#210
Tragic
82.3%
Immigrants | Syria
6.6
/100
|
#211
Tragic
82.3%
Ecuadorians
6.3
/100
|
#212
Tragic
82.3%
Immigrants | Uzbekistan
5.8
/100
|
#213
Tragic
82.3%
Immigrants | Panama
5.6
/100
|
#214
Tragic
82.2%
Iraqis
5.6
/100
|
#215
Tragic
82.2%
Scottish
5.3
/100
|
#216
Tragic
82.2%
Portuguese
4.7
/100
|
#217
Tragic
82.2%
English
4.4
/100
|
#218
Tragic
82.2%
French
4.1
/100
|
#219
Tragic
82.2%
Bahamians
3.6
/100
|
#220
Tragic
82.2%
Panamanians
3.5
/100
|
#221
Tragic
82.2%
Immigrants | Ecuador
3.4
/100
|
#222
Tragic
82.2%
Immigrants | Immigrants
3.1
/100
|
#223
Tragic
82.1%
Immigrants | Jamaica
2.7
/100
|
#224
Tragic
82.1%