Immigrants from Nigeria vs Sierra Leonean In Labor Force | Age 45-54
COMPARE
Immigrants from Nigeria
Sierra Leonean
In Labor Force | Age 45-54
In Labor Force | Age 45-54 Comparison
Immigrants from Nigeria
Sierra Leoneans
83.0%
IN LABOR FORCE | AGE 45-54
74.1/ 100
METRIC RATING
148th/ 347
METRIC RANK
84.5%
IN LABOR FORCE | AGE 45-54
100.0/ 100
METRIC RATING
8th/ 347
METRIC RANK
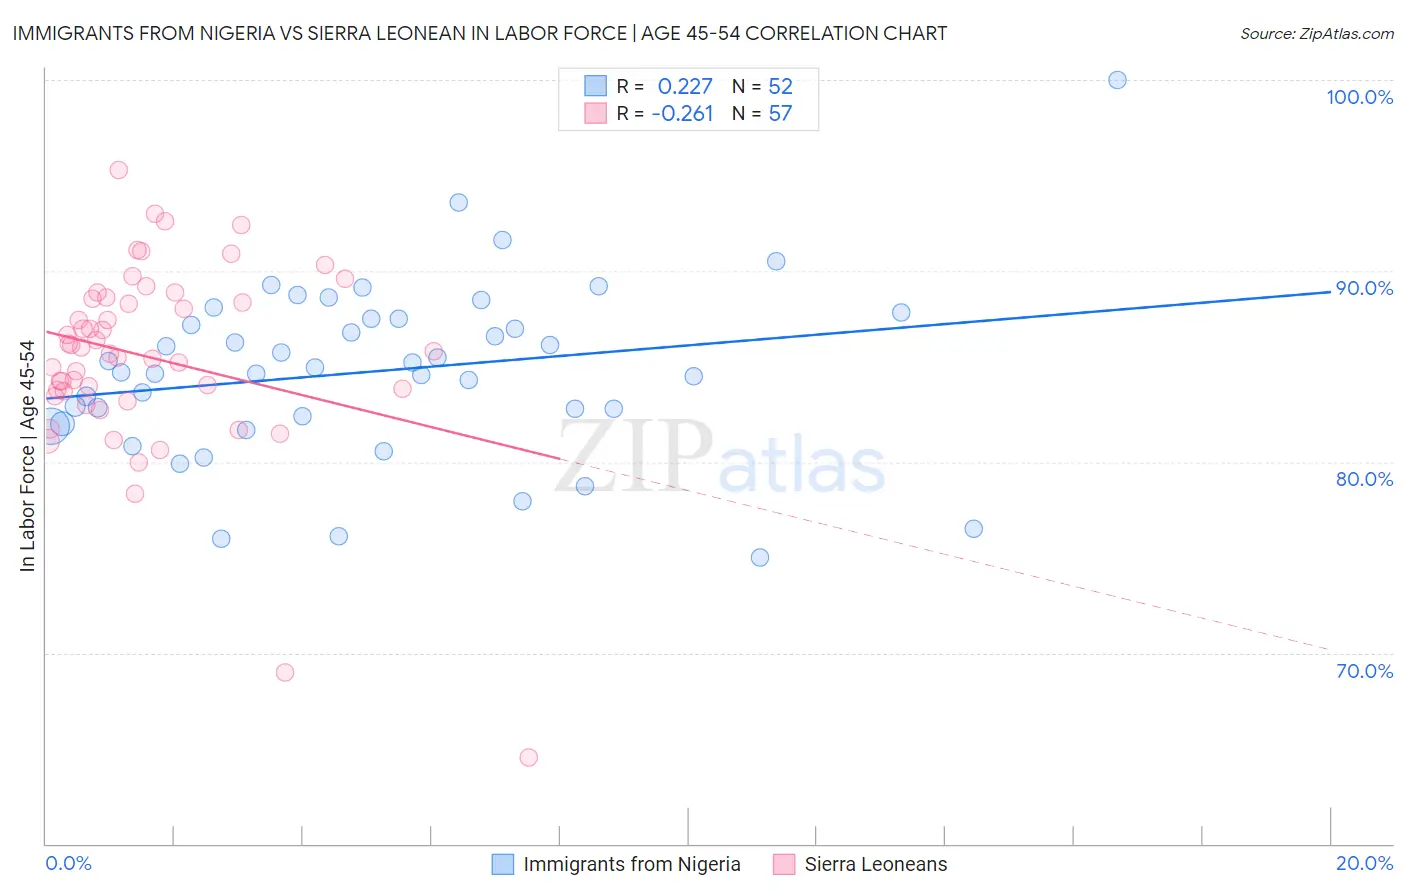
Immigrants from Nigeria vs Sierra Leonean In Labor Force | Age 45-54 Correlation Chart
The statistical analysis conducted on geographies consisting of 283,287,443 people shows a weak positive correlation between the proportion of Immigrants from Nigeria and labor force participation rate among population between the ages 45 and 54 in the United States with a correlation coefficient (R) of 0.227 and weighted average of 83.0%. Similarly, the statistical analysis conducted on geographies consisting of 83,350,060 people shows a weak negative correlation between the proportion of Sierra Leoneans and labor force participation rate among population between the ages 45 and 54 in the United States with a correlation coefficient (R) of -0.261 and weighted average of 84.5%, a difference of 1.9%.
In Labor Force | Age 45-54 Correlation Summary
| Measurement | Immigrants from Nigeria | Sierra Leonean |
| Minimum | 75.0% | 64.5% |
| Maximum | 100.0% | 95.3% |
| Range | 25.0% | 30.8% |
| Mean | 84.8% | 85.5% |
| Median | 84.8% | 85.8% |
| Interquartile 25% (IQ1) | 82.2% | 83.6% |
| Interquartile 75% (IQ3) | 87.5% | 88.6% |
| Interquartile Range (IQR) | 5.3% | 5.0% |
| Standard Deviation (Sample) | 4.6% | 5.1% |
| Standard Deviation (Population) | 4.6% | 5.0% |
Similar Demographics by In Labor Force | Age 45-54
Demographics Similar to Immigrants from Nigeria by In Labor Force | Age 45-54
In terms of in labor force | age 45-54, the demographic groups most similar to Immigrants from Nigeria are Immigrants from France (83.0%, a difference of 0.010%), Czechoslovakian (83.0%, a difference of 0.010%), Immigrants from Sweden (82.9%, a difference of 0.010%), Romanian (83.0%, a difference of 0.020%), and Immigrants from Netherlands (82.9%, a difference of 0.020%).
| Demographics | Rating | Rank | In Labor Force | Age 45-54 |
| Immigrants | Haiti | 77.9 /100 | #141 | Good 83.0% |
| Immigrants | Scotland | 77.8 /100 | #142 | Good 83.0% |
| Okinawans | 77.0 /100 | #143 | Good 83.0% |
| Soviet Union | 76.8 /100 | #144 | Good 83.0% |
| Romanians | 75.4 /100 | #145 | Good 83.0% |
| Immigrants | France | 75.3 /100 | #146 | Good 83.0% |
| Czechoslovakians | 74.8 /100 | #147 | Good 83.0% |
| Immigrants | Nigeria | 74.1 /100 | #148 | Good 83.0% |
| Immigrants | Sweden | 73.3 /100 | #149 | Good 82.9% |
| Immigrants | Netherlands | 72.6 /100 | #150 | Good 82.9% |
| Koreans | 71.9 /100 | #151 | Good 82.9% |
| Slavs | 71.5 /100 | #152 | Good 82.9% |
| Immigrants | Indonesia | 70.6 /100 | #153 | Good 82.9% |
| Immigrants | Ghana | 70.3 /100 | #154 | Good 82.9% |
| Immigrants | Philippines | 69.0 /100 | #155 | Good 82.9% |
Demographics Similar to Sierra Leoneans by In Labor Force | Age 45-54
In terms of in labor force | age 45-54, the demographic groups most similar to Sierra Leoneans are Immigrants from Cameroon (84.6%, a difference of 0.11%), Immigrants from Sierra Leone (84.4%, a difference of 0.11%), Norwegian (84.4%, a difference of 0.13%), Immigrants from India (84.7%, a difference of 0.18%), and Thai (84.3%, a difference of 0.22%).
| Demographics | Rating | Rank | In Labor Force | Age 45-54 |
| Immigrants | Bolivia | 100.0 /100 | #1 | Exceptional 85.3% |
| Luxembourgers | 100.0 /100 | #2 | Exceptional 85.0% |
| Bolivians | 100.0 /100 | #3 | Exceptional 84.9% |
| Immigrants | Ethiopia | 100.0 /100 | #4 | Exceptional 84.8% |
| Ethiopians | 100.0 /100 | #5 | Exceptional 84.8% |
| Immigrants | India | 100.0 /100 | #6 | Exceptional 84.7% |
| Immigrants | Cameroon | 100.0 /100 | #7 | Exceptional 84.6% |
| Sierra Leoneans | 100.0 /100 | #8 | Exceptional 84.5% |
| Immigrants | Sierra Leone | 100.0 /100 | #9 | Exceptional 84.4% |
| Norwegians | 100.0 /100 | #10 | Exceptional 84.4% |
| Thais | 100.0 /100 | #11 | Exceptional 84.3% |
| Bulgarians | 100.0 /100 | #12 | Exceptional 84.2% |
| Chinese | 99.9 /100 | #13 | Exceptional 84.1% |
| Cambodians | 99.9 /100 | #14 | Exceptional 84.1% |
| Cypriots | 99.9 /100 | #15 | Exceptional 84.1% |