Immigrants from Nigeria vs Immigrants from Indonesia In Labor Force | Age 16-19
COMPARE
Immigrants from Nigeria
Immigrants from Indonesia
In Labor Force | Age 16-19
In Labor Force | Age 16-19 Comparison
Immigrants from Nigeria
Immigrants from Indonesia
35.8%
IN LABOR FORCE | AGE 16-19
16.8/ 100
METRIC RATING
203rd/ 347
METRIC RANK
33.5%
IN LABOR FORCE | AGE 16-19
0.1/ 100
METRIC RATING
288th/ 347
METRIC RANK
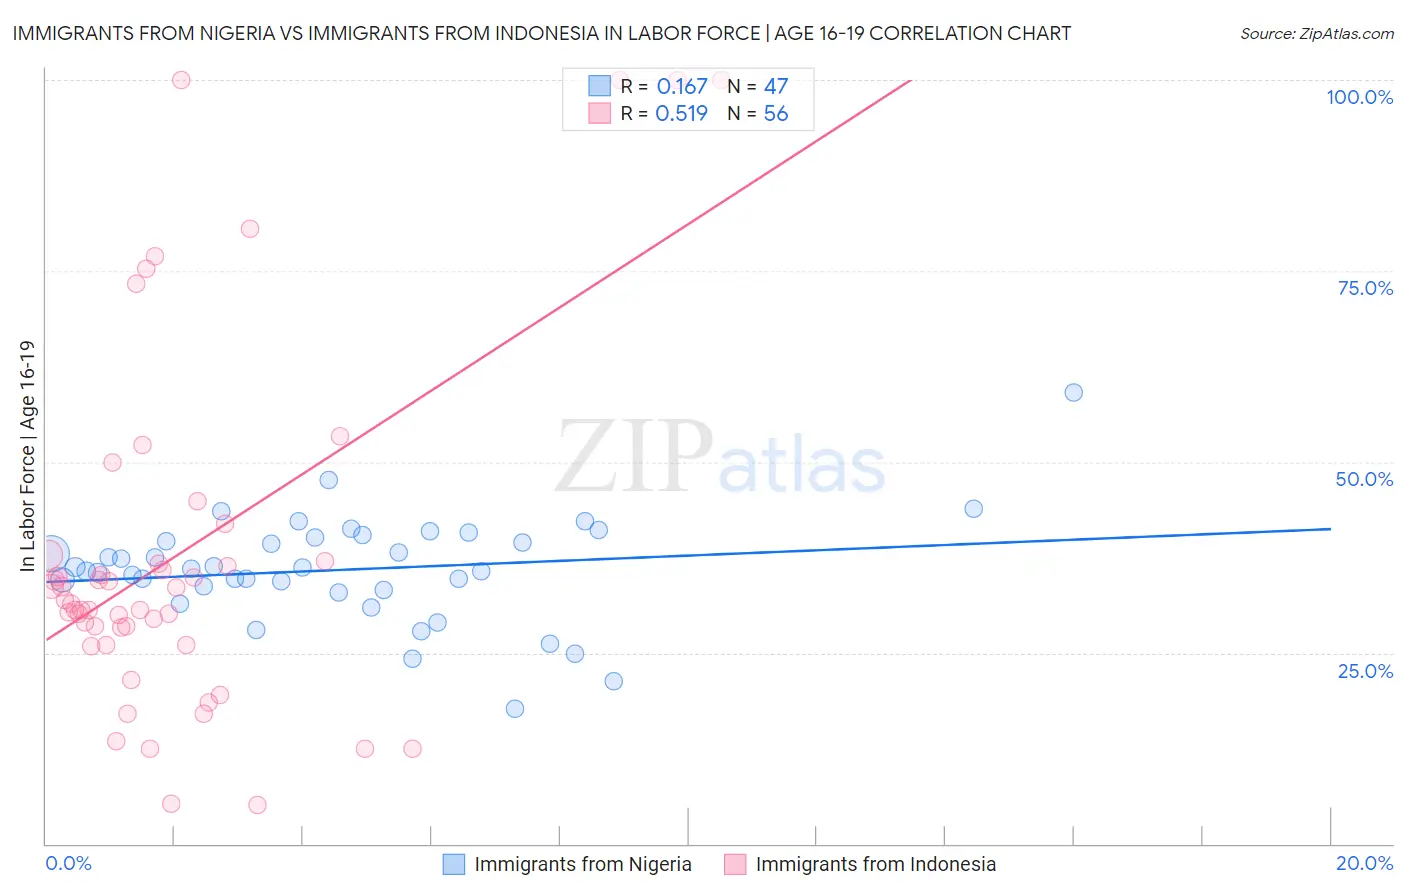
Immigrants from Nigeria vs Immigrants from Indonesia In Labor Force | Age 16-19 Correlation Chart
The statistical analysis conducted on geographies consisting of 283,352,648 people shows a poor positive correlation between the proportion of Immigrants from Nigeria and labor force participation rate among population between the ages 16 and 19 in the United States with a correlation coefficient (R) of 0.167 and weighted average of 35.8%. Similarly, the statistical analysis conducted on geographies consisting of 215,635,356 people shows a substantial positive correlation between the proportion of Immigrants from Indonesia and labor force participation rate among population between the ages 16 and 19 in the United States with a correlation coefficient (R) of 0.519 and weighted average of 33.5%, a difference of 7.0%.
In Labor Force | Age 16-19 Correlation Summary
| Measurement | Immigrants from Nigeria | Immigrants from Indonesia |
| Minimum | 17.6% | 5.1% |
| Maximum | 59.1% | 100.0% |
| Range | 41.5% | 94.9% |
| Mean | 35.9% | 37.9% |
| Median | 35.9% | 31.7% |
| Interquartile 25% (IQ1) | 33.2% | 27.2% |
| Interquartile 75% (IQ3) | 40.2% | 37.4% |
| Interquartile Range (IQR) | 6.9% | 10.2% |
| Standard Deviation (Sample) | 7.0% | 23.4% |
| Standard Deviation (Population) | 6.9% | 23.2% |
Similar Demographics by In Labor Force | Age 16-19
Demographics Similar to Immigrants from Nigeria by In Labor Force | Age 16-19
In terms of in labor force | age 16-19, the demographic groups most similar to Immigrants from Nigeria are Senegalese (35.9%, a difference of 0.060%), Alsatian (35.9%, a difference of 0.070%), Immigrants from Albania (35.8%, a difference of 0.17%), Immigrants from Sweden (35.9%, a difference of 0.18%), and South American Indian (35.8%, a difference of 0.21%).
| Demographics | Rating | Rank | In Labor Force | Age 16-19 |
| Mexican American Indians | 21.1 /100 | #196 | Fair 36.0% |
| Immigrants | Serbia | 21.0 /100 | #197 | Fair 36.0% |
| Immigrants | Northern Africa | 19.9 /100 | #198 | Poor 35.9% |
| Immigrants | Norway | 19.8 /100 | #199 | Poor 35.9% |
| Immigrants | Sweden | 18.8 /100 | #200 | Poor 35.9% |
| Alsatians | 17.5 /100 | #201 | Poor 35.9% |
| Senegalese | 17.4 /100 | #202 | Poor 35.9% |
| Immigrants | Nigeria | 16.8 /100 | #203 | Poor 35.8% |
| Immigrants | Albania | 15.0 /100 | #204 | Poor 35.8% |
| South American Indians | 14.6 /100 | #205 | Poor 35.8% |
| Chileans | 14.6 /100 | #206 | Poor 35.8% |
| Immigrants | Eastern Europe | 14.5 /100 | #207 | Poor 35.8% |
| Koreans | 13.3 /100 | #208 | Poor 35.7% |
| Moroccans | 12.7 /100 | #209 | Poor 35.7% |
| Immigrants | Switzerland | 11.9 /100 | #210 | Poor 35.6% |
Demographics Similar to Immigrants from Indonesia by In Labor Force | Age 16-19
In terms of in labor force | age 16-19, the demographic groups most similar to Immigrants from Indonesia are Immigrants from Singapore (33.5%, a difference of 0.0%), Nepalese (33.5%, a difference of 0.040%), Immigrants from Colombia (33.5%, a difference of 0.14%), Immigrants from Belarus (33.4%, a difference of 0.22%), and South American (33.6%, a difference of 0.27%).
| Demographics | Rating | Rank | In Labor Force | Age 16-19 |
| Cypriots | 0.3 /100 | #281 | Tragic 33.8% |
| Immigrants | Korea | 0.3 /100 | #282 | Tragic 33.8% |
| Immigrants | Venezuela | 0.2 /100 | #283 | Tragic 33.7% |
| Immigrants | Spain | 0.2 /100 | #284 | Tragic 33.7% |
| U.S. Virgin Islanders | 0.2 /100 | #285 | Tragic 33.6% |
| South Americans | 0.2 /100 | #286 | Tragic 33.6% |
| Nepalese | 0.1 /100 | #287 | Tragic 33.5% |
| Immigrants | Indonesia | 0.1 /100 | #288 | Tragic 33.5% |
| Immigrants | Singapore | 0.1 /100 | #289 | Tragic 33.5% |
| Immigrants | Colombia | 0.1 /100 | #290 | Tragic 33.5% |
| Immigrants | Belarus | 0.1 /100 | #291 | Tragic 33.4% |
| Haitians | 0.1 /100 | #292 | Tragic 33.4% |
| Immigrants | South America | 0.1 /100 | #293 | Tragic 33.3% |
| Argentineans | 0.1 /100 | #294 | Tragic 33.3% |
| Yup'ik | 0.1 /100 | #295 | Tragic 33.3% |