Immigrants from Nigeria vs Immigrants from Ghana 4th Grade
COMPARE
Immigrants from Nigeria
Immigrants from Ghana
4th Grade
4th Grade Comparison
Immigrants from Nigeria
Immigrants from Ghana
97.0%
4TH GRADE
0.3/ 100
METRIC RATING
267th/ 347
METRIC RANK
96.9%
4TH GRADE
0.1/ 100
METRIC RATING
275th/ 347
METRIC RANK
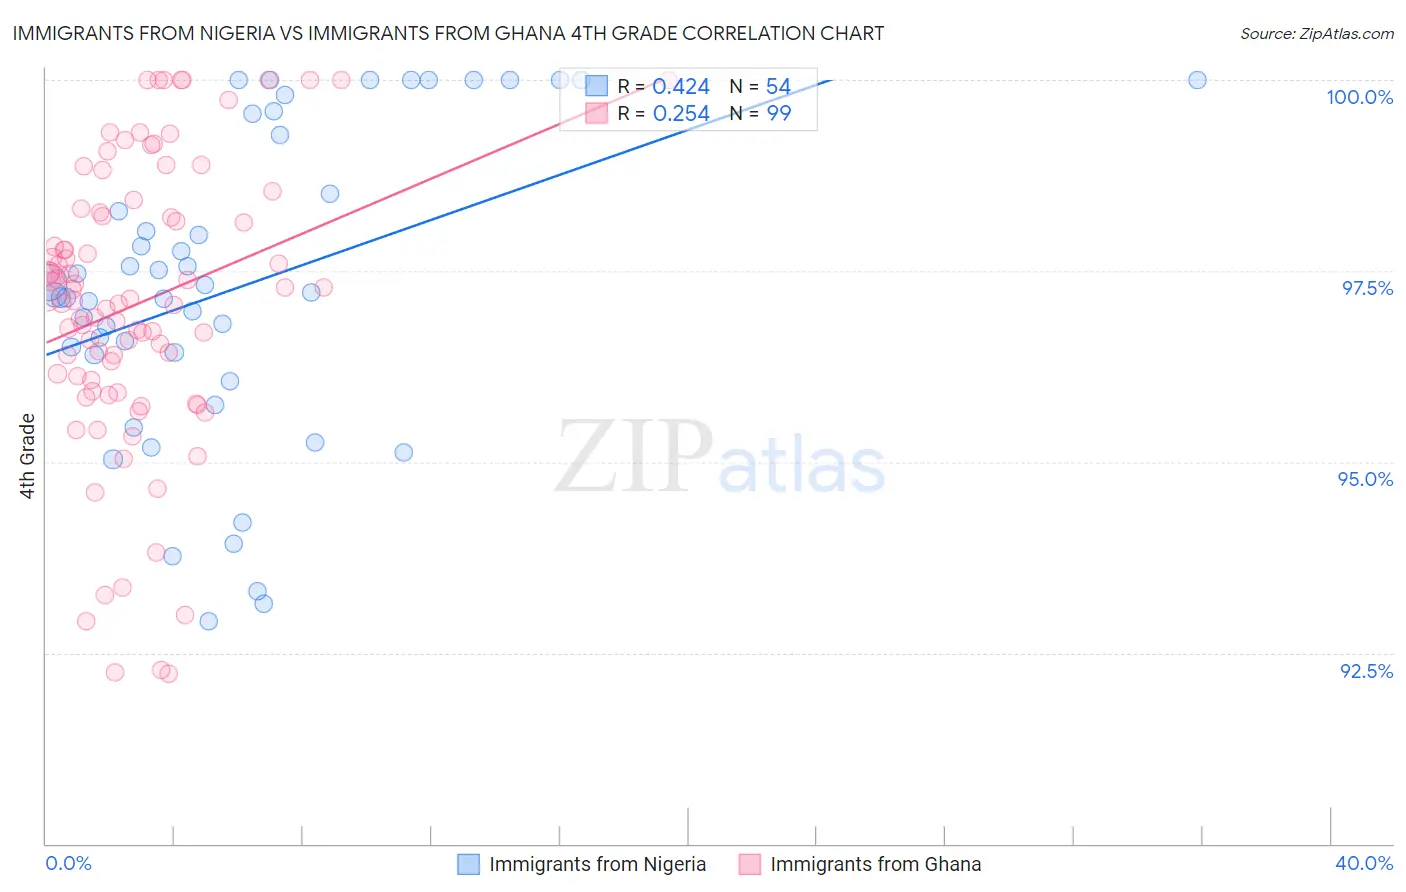
Immigrants from Nigeria vs Immigrants from Ghana 4th Grade Correlation Chart
The statistical analysis conducted on geographies consisting of 283,430,369 people shows a moderate positive correlation between the proportion of Immigrants from Nigeria and percentage of population with at least 4th grade education in the United States with a correlation coefficient (R) of 0.424 and weighted average of 97.0%. Similarly, the statistical analysis conducted on geographies consisting of 199,952,023 people shows a weak positive correlation between the proportion of Immigrants from Ghana and percentage of population with at least 4th grade education in the United States with a correlation coefficient (R) of 0.254 and weighted average of 96.9%, a difference of 0.090%.
4th Grade Correlation Summary
| Measurement | Immigrants from Nigeria | Immigrants from Ghana |
| Minimum | 92.9% | 92.2% |
| Maximum | 100.0% | 100.0% |
| Range | 7.1% | 7.8% |
| Mean | 97.3% | 97.1% |
| Median | 97.2% | 97.1% |
| Interquartile 25% (IQ1) | 96.4% | 96.1% |
| Interquartile 75% (IQ3) | 99.3% | 98.3% |
| Interquartile Range (IQR) | 2.9% | 2.2% |
| Standard Deviation (Sample) | 2.0% | 1.9% |
| Standard Deviation (Population) | 2.0% | 1.8% |
Demographics Similar to Immigrants from Nigeria and Immigrants from Ghana by 4th Grade
In terms of 4th grade, the demographic groups most similar to Immigrants from Nigeria are Immigrants from China (97.0%, a difference of 0.0%), Taiwanese (97.0%, a difference of 0.010%), Armenian (97.0%, a difference of 0.010%), Ghanaian (97.0%, a difference of 0.010%), and Immigrants from Jamaica (97.0%, a difference of 0.020%). Similarly, the demographic groups most similar to Immigrants from Ghana are Yaqui (96.9%, a difference of 0.0%), Trinidadian and Tobagonian (96.9%, a difference of 0.010%), Immigrants from Western Africa (96.9%, a difference of 0.010%), Immigrants from Bolivia (96.9%, a difference of 0.010%), and Immigrants from Peru (96.9%, a difference of 0.020%).
| Demographics | Rating | Rank | 4th Grade |
| Immigrants | South America | 0.4 /100 | #261 | Tragic 97.0% |
| West Indians | 0.4 /100 | #262 | Tragic 97.0% |
| Immigrants | Jamaica | 0.3 /100 | #263 | Tragic 97.0% |
| Taiwanese | 0.3 /100 | #264 | Tragic 97.0% |
| Armenians | 0.3 /100 | #265 | Tragic 97.0% |
| Immigrants | China | 0.3 /100 | #266 | Tragic 97.0% |
| Immigrants | Nigeria | 0.3 /100 | #267 | Tragic 97.0% |
| Ghanaians | 0.2 /100 | #268 | Tragic 97.0% |
| Immigrants | Uzbekistan | 0.2 /100 | #269 | Tragic 96.9% |
| Cubans | 0.2 /100 | #270 | Tragic 96.9% |
| Immigrants | Peru | 0.1 /100 | #271 | Tragic 96.9% |
| Fijians | 0.1 /100 | #272 | Tragic 96.9% |
| Immigrants | Cameroon | 0.1 /100 | #273 | Tragic 96.9% |
| Trinidadians and Tobagonians | 0.1 /100 | #274 | Tragic 96.9% |
| Immigrants | Ghana | 0.1 /100 | #275 | Tragic 96.9% |
| Yaqui | 0.1 /100 | #276 | Tragic 96.9% |
| Immigrants | Western Africa | 0.1 /100 | #277 | Tragic 96.9% |
| Immigrants | Bolivia | 0.1 /100 | #278 | Tragic 96.9% |
| Afghans | 0.1 /100 | #279 | Tragic 96.9% |
| Barbadians | 0.1 /100 | #280 | Tragic 96.9% |
| Immigrants | Hong Kong | 0.1 /100 | #281 | Tragic 96.9% |