Immigrants from Nigeria vs Immigrants from Honduras In Labor Force | Age 16-19
COMPARE
Immigrants from Nigeria
Immigrants from Honduras
In Labor Force | Age 16-19
In Labor Force | Age 16-19 Comparison
Immigrants from Nigeria
Immigrants from Honduras
35.8%
IN LABOR FORCE | AGE 16-19
16.8/ 100
METRIC RATING
203rd/ 347
METRIC RANK
35.2%
IN LABOR FORCE | AGE 16-19
4.9/ 100
METRIC RATING
230th/ 347
METRIC RANK
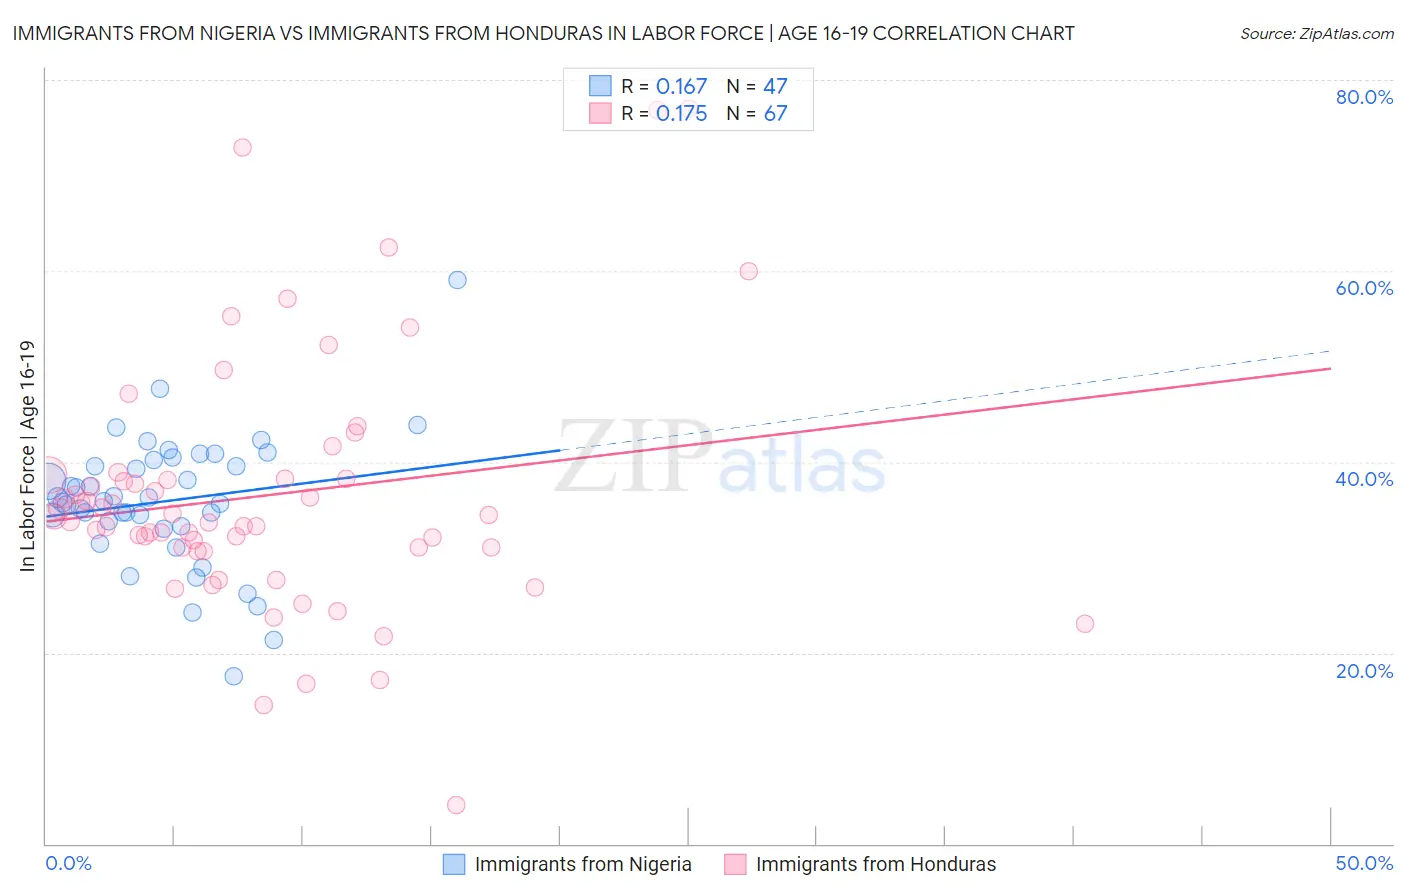
Immigrants from Nigeria vs Immigrants from Honduras In Labor Force | Age 16-19 Correlation Chart
The statistical analysis conducted on geographies consisting of 283,352,648 people shows a poor positive correlation between the proportion of Immigrants from Nigeria and labor force participation rate among population between the ages 16 and 19 in the United States with a correlation coefficient (R) of 0.167 and weighted average of 35.8%. Similarly, the statistical analysis conducted on geographies consisting of 322,269,112 people shows a poor positive correlation between the proportion of Immigrants from Honduras and labor force participation rate among population between the ages 16 and 19 in the United States with a correlation coefficient (R) of 0.175 and weighted average of 35.2%, a difference of 1.8%.
In Labor Force | Age 16-19 Correlation Summary
| Measurement | Immigrants from Nigeria | Immigrants from Honduras |
| Minimum | 17.6% | 4.1% |
| Maximum | 59.1% | 77.0% |
| Range | 41.5% | 72.9% |
| Mean | 35.9% | 36.5% |
| Median | 35.9% | 34.3% |
| Interquartile 25% (IQ1) | 33.2% | 31.0% |
| Interquartile 75% (IQ3) | 40.2% | 38.2% |
| Interquartile Range (IQR) | 6.9% | 7.2% |
| Standard Deviation (Sample) | 7.0% | 13.2% |
| Standard Deviation (Population) | 6.9% | 13.1% |
Similar Demographics by In Labor Force | Age 16-19
Demographics Similar to Immigrants from Nigeria by In Labor Force | Age 16-19
In terms of in labor force | age 16-19, the demographic groups most similar to Immigrants from Nigeria are Senegalese (35.9%, a difference of 0.060%), Alsatian (35.9%, a difference of 0.070%), Immigrants from Albania (35.8%, a difference of 0.17%), Immigrants from Sweden (35.9%, a difference of 0.18%), and South American Indian (35.8%, a difference of 0.21%).
| Demographics | Rating | Rank | In Labor Force | Age 16-19 |
| Mexican American Indians | 21.1 /100 | #196 | Fair 36.0% |
| Immigrants | Serbia | 21.0 /100 | #197 | Fair 36.0% |
| Immigrants | Northern Africa | 19.9 /100 | #198 | Poor 35.9% |
| Immigrants | Norway | 19.8 /100 | #199 | Poor 35.9% |
| Immigrants | Sweden | 18.8 /100 | #200 | Poor 35.9% |
| Alsatians | 17.5 /100 | #201 | Poor 35.9% |
| Senegalese | 17.4 /100 | #202 | Poor 35.9% |
| Immigrants | Nigeria | 16.8 /100 | #203 | Poor 35.8% |
| Immigrants | Albania | 15.0 /100 | #204 | Poor 35.8% |
| South American Indians | 14.6 /100 | #205 | Poor 35.8% |
| Chileans | 14.6 /100 | #206 | Poor 35.8% |
| Immigrants | Eastern Europe | 14.5 /100 | #207 | Poor 35.8% |
| Koreans | 13.3 /100 | #208 | Poor 35.7% |
| Moroccans | 12.7 /100 | #209 | Poor 35.7% |
| Immigrants | Switzerland | 11.9 /100 | #210 | Poor 35.6% |
Demographics Similar to Immigrants from Honduras by In Labor Force | Age 16-19
In terms of in labor force | age 16-19, the demographic groups most similar to Immigrants from Honduras are Immigrants from Lebanon (35.2%, a difference of 0.030%), Immigrants from Syria (35.2%, a difference of 0.12%), Immigrants from Kazakhstan (35.2%, a difference of 0.12%), Immigrants from Senegal (35.3%, a difference of 0.16%), and Immigrants from France (35.1%, a difference of 0.17%).
| Demographics | Rating | Rank | In Labor Force | Age 16-19 |
| Ghanaians | 6.5 /100 | #223 | Tragic 35.3% |
| Hondurans | 6.5 /100 | #224 | Tragic 35.3% |
| Immigrants | Belgium | 6.1 /100 | #225 | Tragic 35.3% |
| Immigrants | Guatemala | 5.7 /100 | #226 | Tragic 35.3% |
| Mongolians | 5.7 /100 | #227 | Tragic 35.3% |
| Immigrants | Senegal | 5.5 /100 | #228 | Tragic 35.3% |
| Immigrants | Lebanon | 5.0 /100 | #229 | Tragic 35.2% |
| Immigrants | Honduras | 4.9 /100 | #230 | Tragic 35.2% |
| Immigrants | Syria | 4.5 /100 | #231 | Tragic 35.2% |
| Immigrants | Kazakhstan | 4.5 /100 | #232 | Tragic 35.2% |
| Immigrants | France | 4.3 /100 | #233 | Tragic 35.1% |
| Immigrants | Mexico | 4.2 /100 | #234 | Tragic 35.1% |
| Immigrants | Philippines | 4.0 /100 | #235 | Tragic 35.1% |
| Immigrants | Australia | 3.6 /100 | #236 | Tragic 35.1% |
| Immigrants | India | 3.5 /100 | #237 | Tragic 35.0% |