Immigrants from Nigeria vs Bermudan In Labor Force | Age 20-24
COMPARE
Immigrants from Nigeria
Bermudan
In Labor Force | Age 20-24
In Labor Force | Age 20-24 Comparison
Immigrants from Nigeria
Bermudans
74.7%
IN LABOR FORCE | AGE 20-24
24.2/ 100
METRIC RATING
198th/ 347
METRIC RANK
74.1%
IN LABOR FORCE | AGE 20-24
3.2/ 100
METRIC RATING
237th/ 347
METRIC RANK
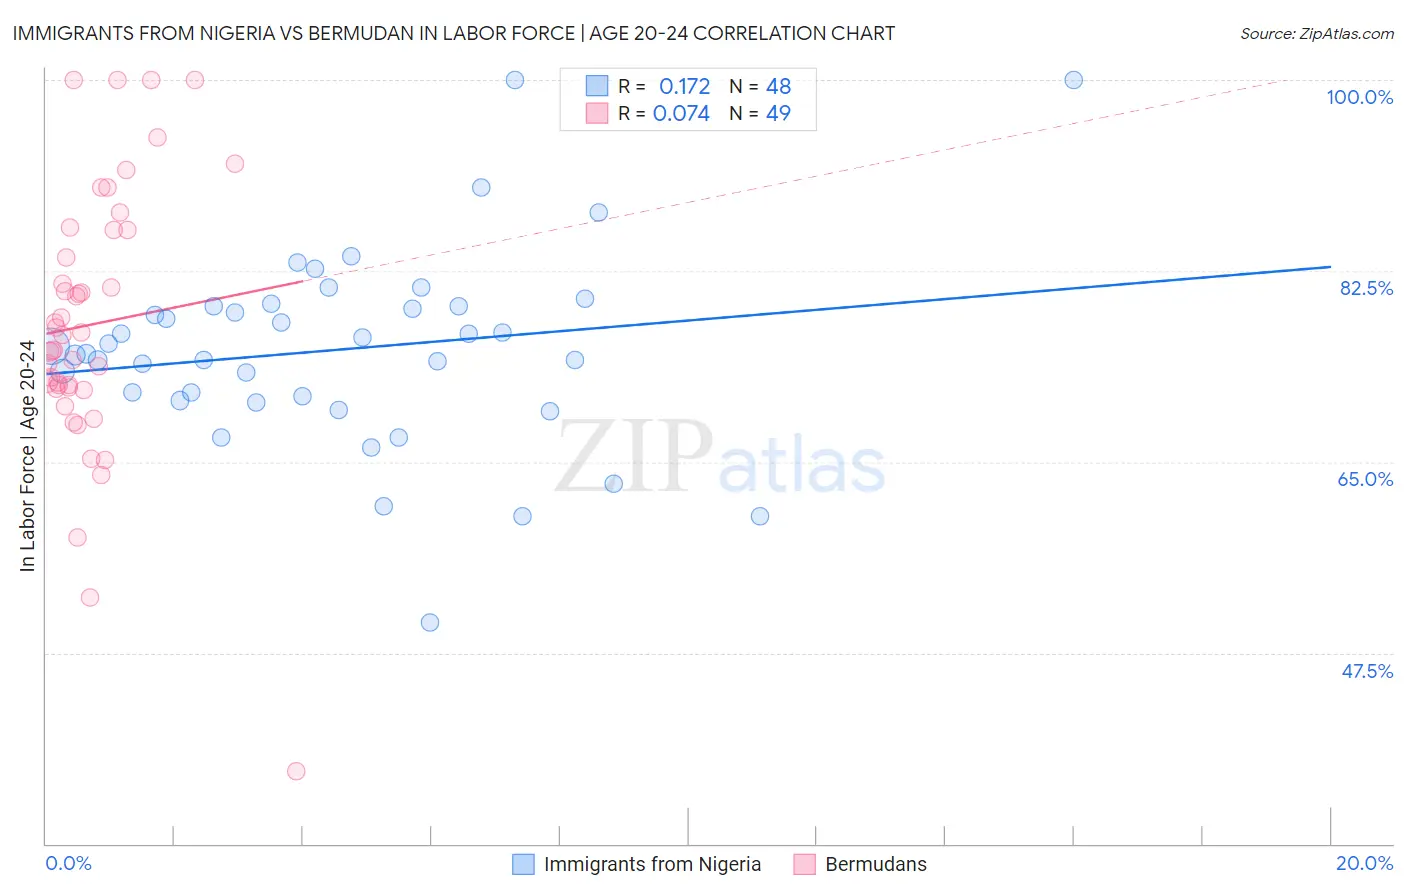
Immigrants from Nigeria vs Bermudan In Labor Force | Age 20-24 Correlation Chart
The statistical analysis conducted on geographies consisting of 283,465,433 people shows a poor positive correlation between the proportion of Immigrants from Nigeria and labor force participation rate among population between the ages 20 and 24 in the United States with a correlation coefficient (R) of 0.172 and weighted average of 74.7%. Similarly, the statistical analysis conducted on geographies consisting of 55,728,431 people shows a slight positive correlation between the proportion of Bermudans and labor force participation rate among population between the ages 20 and 24 in the United States with a correlation coefficient (R) of 0.074 and weighted average of 74.1%, a difference of 0.84%.
In Labor Force | Age 20-24 Correlation Summary
| Measurement | Immigrants from Nigeria | Bermudan |
| Minimum | 50.3% | 36.7% |
| Maximum | 100.0% | 100.0% |
| Range | 49.7% | 63.3% |
| Mean | 75.3% | 77.6% |
| Median | 75.2% | 76.7% |
| Interquartile 25% (IQ1) | 70.8% | 71.8% |
| Interquartile 75% (IQ3) | 79.3% | 86.2% |
| Interquartile Range (IQR) | 8.5% | 14.4% |
| Standard Deviation (Sample) | 9.0% | 12.3% |
| Standard Deviation (Population) | 8.9% | 12.1% |
Similar Demographics by In Labor Force | Age 20-24
Demographics Similar to Immigrants from Nigeria by In Labor Force | Age 20-24
In terms of in labor force | age 20-24, the demographic groups most similar to Immigrants from Nigeria are Eastern European (74.8%, a difference of 0.020%), Immigrants from Vietnam (74.7%, a difference of 0.020%), Panamanian (74.7%, a difference of 0.020%), Taiwanese (74.7%, a difference of 0.020%), and Immigrants from Denmark (74.8%, a difference of 0.030%).
| Demographics | Rating | Rank | In Labor Force | Age 20-24 |
| Senegalese | 28.1 /100 | #191 | Fair 74.8% |
| Immigrants | Europe | 27.5 /100 | #192 | Fair 74.8% |
| Alsatians | 27.1 /100 | #193 | Fair 74.8% |
| Immigrants | Denmark | 25.8 /100 | #194 | Fair 74.8% |
| Eastern Europeans | 25.4 /100 | #195 | Fair 74.8% |
| Immigrants | Vietnam | 25.1 /100 | #196 | Fair 74.7% |
| Panamanians | 25.0 /100 | #197 | Fair 74.7% |
| Immigrants | Nigeria | 24.2 /100 | #198 | Fair 74.7% |
| Taiwanese | 23.2 /100 | #199 | Fair 74.7% |
| Nigerians | 21.9 /100 | #200 | Fair 74.7% |
| Choctaw | 21.4 /100 | #201 | Fair 74.7% |
| Moroccans | 20.4 /100 | #202 | Fair 74.7% |
| Immigrants | Northern Africa | 17.9 /100 | #203 | Poor 74.6% |
| Immigrants | Italy | 17.6 /100 | #204 | Poor 74.6% |
| Inupiat | 17.6 /100 | #205 | Poor 74.6% |
Demographics Similar to Bermudans by In Labor Force | Age 20-24
In terms of in labor force | age 20-24, the demographic groups most similar to Bermudans are Immigrants from France (74.1%, a difference of 0.010%), Laotian (74.1%, a difference of 0.030%), Immigrants from Japan (74.1%, a difference of 0.030%), Immigrants (74.1%, a difference of 0.040%), and Immigrants from Chile (74.1%, a difference of 0.050%).
| Demographics | Rating | Rank | In Labor Force | Age 20-24 |
| Immigrants | Albania | 4.3 /100 | #230 | Tragic 74.2% |
| Immigrants | Greece | 4.1 /100 | #231 | Tragic 74.2% |
| Immigrants | Switzerland | 4.1 /100 | #232 | Tragic 74.2% |
| Immigrants | Chile | 3.7 /100 | #233 | Tragic 74.1% |
| Immigrants | Immigrants | 3.6 /100 | #234 | Tragic 74.1% |
| Laotians | 3.5 /100 | #235 | Tragic 74.1% |
| Immigrants | France | 3.3 /100 | #236 | Tragic 74.1% |
| Bermudans | 3.2 /100 | #237 | Tragic 74.1% |
| Immigrants | Japan | 3.0 /100 | #238 | Tragic 74.1% |
| Immigrants | Latin America | 2.7 /100 | #239 | Tragic 74.1% |
| Immigrants | Sri Lanka | 2.3 /100 | #240 | Tragic 74.0% |
| Immigrants | Senegal | 2.1 /100 | #241 | Tragic 74.0% |
| Thais | 2.1 /100 | #242 | Tragic 74.0% |
| Immigrants | Syria | 1.9 /100 | #243 | Tragic 74.0% |
| Immigrants | South Central Asia | 1.9 /100 | #244 | Tragic 74.0% |